세가지 색상차이를 보이는 착색제를 이용한 치아 우식 관련 균에 관한 연구
Study of Bacteria Associated with Dental Caries Using a 3 Tone Disclosing Agent
Article information
Abstract
본 연구는 치태의 성숙도에 따라 치태를 서로 다른 색상으로 염색하는 GC Tri Plaque ID Gel™(GC corporation, Tokyo, Japan)을 이용하여 치아 우식 위험도를 평가하고자 하였다. 치아 우식의 발생 및 진행과 연관된 균인 Streptococcus mutans, Streptococcus sobrinus, Lactobacillus spp .의 수를 Quantitative real-time polymerase chain reaction (qRT-PCR)로 측정하여 치아 우식 위험도를 보았다.
본 실험은 강릉원주대학교 치과병원 임상시험 심사위원회의 심의를 받고 진행하였다. 강릉원주대학교 치과병원 소아치과에 내원한 전신질환이 없는 건강한 9 - 12세의 초등학생 15명의 치면을 착색제로 염색하였다. 치태의 성숙도에 따라 서로 다른 세가지 색상으로 염색되었으며 색상별로 3개의 실험군인 Ⅰ군(pink/red), Ⅱ군(blue/purple), Ⅲ군(light blue)으로 나누었다. 3개의 실험군에서 각각 DNA를 추출한 후, qRT-PCR을 이용하여 S. mutans, S. sobrinus, Lactobacillus spp .의 수를 측정하였다.
3개의 실험군 사이에 S. mutans, S. sobrinus 와 Lactobacillus spp . 균 수의 유의한 차이가 관찰되었으며 3종류의 균 모두 Ⅲ군에서 가장 많이 관찰되었다(p < 0.05).
GC Tri Plaque ID Gel™는 기존 착색제와는 달리 치태의 성숙도에 따라 서로 다른 세가지 색상으로 염색되며, 치태 염색 색상의 차이는 치아 우식 관련 균 수의 차이를 보여주었다. GC Tri Plaque ID Gel™이 치아 우식 위험도를 평가하는 하나의 지표로서 사용될 수 있는 가능성을 확인하였다.
Trans Abstract
The aim of this study was to determine the efficacy of a 3 tone plaque disclosing gel in assessing the risk of caries related to the population of Streptococcus mutans , Streptococcus sobrinus , and Lactobacillus spp . quantified using a quantitative real-time polymerase chain reaction (qRT-PCR).
15 healthy children of ages 9 - 12 years were randomly examined. The 3 tone plaque disclosing gel was applied on teeth surfaces, which changed the color to pink or red, blue or purple and light blue. Plaque was divided into 3 groups based on staining. Genomic DNA from each sample was subjected to a qRT-PCR assay for quantitative detection of target bacteria. The Kruskal-Wallis test was conducted for correlation between the color of plaque and the number of bacterial species.
The levels of S. mutans , S. sobrinus , and Lactobacillus spp . were significantly different in the plaque samples of the 3 groups (p < 0.05). The proportion of S. sobrinus to S. mutans showed correlation to the color of plaque.
The different color-dyed plaque was related to the number of acidogenic bacteria. The 3 tone plaque disclosing gel could be used as one of the indicators to assess the clinical risk of caries associated with the population of S. mutans , S. sobrinus , and Lactobacillus spp.
Ⅰ. Introduction
Dental plaque is the mass of microorganisms that bind on the tooth’s surface. It is estimated that more than 700 species of bacteria live in the oral flora[1,2]. These species can exist as part of the dental biofilm. Dental biofilm is composed of about a 1012 colony forming unit/Ml (CFU/mL)[3]: of which, Streptococcus mutans , Streptococcus sobrinus , and Lactobacillus spp . are significantly associated with the development and progression of dental caries.
In the dental biofilm, determining the number of S. mutans and S. sobrinus is shown to be the method of predicting caries activity[4,5]. S. mutans is more frequently detected than S. sobrinus in the oral cavity[6]. However, several studies have shown that S. sobrinus was more closely associated than S. mutans with high caries activity in children[7]. Children with early childhood caries (ECC) had higher levels of S. mutans and S. sobrinus than children with caries-free dental plaque samples: moreover, children with higher incidence of ECC showed a high ratio of S. sobrinus to S. mutans in their dental plaque samples[8].
While S. mutans and S. sobrinus are significantly linked with the development of dental caries, Lactobacillus spp . are significantly linked with its progression[9]. Lactobacillus spp . have the ability to generate and survive in a low pH environment[10,11]. Moreover, they were reportedly higher in active caries lesions than in arrested caries lesions: and decrease in the level of pH in caries lesions was associated with an increased prevalence of Lactobacillus spp .[12]. The growth of Lactobacillus spp . was more rapid than that of S. mutans at low pH[13,14].
Several studies on the methods of risk-assessment for caries have been conducted in the field of cariology. In addition, several methods have been used to detect S. mutans and identify the pathogenicity of biofilm. However, most of these methods are relatively non-specific, time-consuming, and laborious.
Recently, a 3 tone plaque disclosing gel (GC Tri Plaque ID GelTM: GC corporation, Tokyo, Japan) was developed based on the correlation between caries risks and production of acids from dental plaque in response to sucrose. Although conventional plaque disclosing gel is cost-effective and can be used easily in real-time chairside, it lacks the ability for assessment of plaque ecology such as acid production by fermentation. The 3 tone plaque disclosing gel was developed to aid patient oral hygiene education. It contains different dyes (Rose bengal, Coomassie Brilliant blue, Brilliant Blue FCF) and sucrose. It indicates both dental plaque fermentation and plaque acid production by color within 2 min.
In newly-formed plaque, the biofilm is sparse. Blue pigments are easily washed off because of low molecular weight and red pigments remain because of high molecular weight. So, new plaque is dyed pink or red color. As the biofilm matures (> 48 hours), its structure becomes dense, both red and blue pigments are trapped, and the old plaque is dyed blue or purple in color. In cases with high risk of plaque, the sucrose in the 3 tone plaque disclosing gel is metabolized by acidogenic bacteria in the biofilm. As bacteria produce acid, the plaque pH drops to pH 4.5, which results in the disappearance of red pigments and appearance of a light blue color[15].
In a previous study using the 3 tone plaque disclosing gel, Jayanthi M et al .[15] confirmed the relationship between caries, plaque, and cariogenic microorganisms. As children developed mature and pathological plaque, the number of S. mutans in plaque was increased. This result showed the efficacy of the 3 tone plaque disclosing gel in identifying the risk of caries associated with plaque. However, the relationship between caries progression and cariogenic bacteria was not reported by these authors, since Lactobacillus spp . which is responsible for caries progression was not included in their study.
The aim of this study was to access the efficacy of the 3 tone plaque disclosing gel to assess the clinical risk of caries associated with the population of S. mutans , S. sobrinus , and Lactobacillus spp . quantified using a quantitative real-time polymerase chain reaction (qRT-PCR).
Ⅱ. Materials and methods
The Institutional Review Board (IRB) of Gangneung-Wonju National University dental hospital (IRB No.: 2015-016) approved the study prior to its implementation. A single operator performed all the experimental procedures.
1. Subjects and plaque sampling
15 healthy children aged 9 - 12 years old who visited Gangneung-Wonju National University dental hospital were randomly examined. Children who had not used mouth rinses or any medication during past 3 months and without any prosthetic or orthodontic appliances which modify surface characteristics were included. The children willingly participated in this study and informed parental consent was obtained.
The 3 tone plaque disclosing gel was applied on all tooth surfaces with a microbrush (Fig. 1). The compositions of the 3 tone plaque disclosing gel used in this study are presented in Table 1. Dyed tooth-surfaces were left undisturbed for 2 min. Subsequently, the tooth-surfaces were changed to pink or red, blue or purple, and light blue (Fig. 2). The tooth-surfaces were gently washed using a 3-way syringe for 30 sec. In all 15 children who participated in the experiment, the plaque was stained with 3 tone dyed colors (pink or red, blue or purple, light blue).

The 3 tone plaque disclosing gel was applied on tooth surfaces with a microbrush.
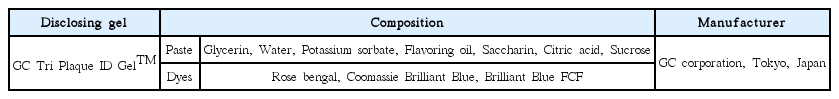
Composition of the 3 tone plaque disclosing gel used in the study
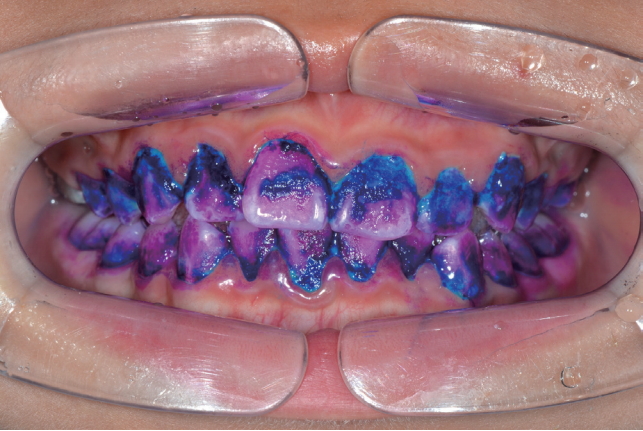
The tooth-surfaces were changed to pink or red, blue or purple, and light blue.
Depending on the colors, the plaque were divided randomly into 3 experimental groups. Group Ⅰ was pink or red plaque. Group Ⅱ was blue or purple plaque. Group Ⅲ was light blue plaque (Table 2).
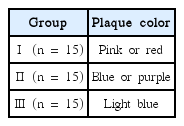
Experimental and group classification
The 3 tone dyed plaque was separately collected from the sound tooth surfaces with a sterile spoon excavator. Only plaque with clearly dyed color was collected. The collection was conducted by a sweeping action and all collected plaque was placed on the supragingiva. Samples were collected from one of the available teeth: sites based on the plaque abundance, maxillary right first molar, mandibular left molar, maxillary incisor or mandibular incisor. The collection sites were chosen from the first preference site to the next available preferred site. To collect the same amount of plaque, plaque was stored in a sterile acrylic resin block (Jet Tooth ShadeTM Powder: Lang Dental Mfg Inc, Wheeling) with a hole that was made by #2 round bur (RA 2 Stainless steel bur: Komet, Germany) penetrating to a 1 mm depth. After collection of the plaque, the extra plaque was cut at the level of the acrylic resin block surface. The acrylic resin blocks with plaque were kept in sterile 1.7 mL tube containing 1 mL sterile distilled water. The samples were stored at -20℃ until extraction of bacterial DNAs.
2. Extraction of DNA
Genomic DNA Extraction Kit (iNtRON Biotechnology Inc., Sungnam, Korea) was used to extract and purify bacterial DNAs from each plaque sample. DNAs were extracted according to the manufacturer’s procedures. Briefly, plaque sample and acrylic resin block was stored at -20℃ sterile in 1.7 mL tube containing 1 mL sterile distilled water. The mixture was mixed vigorously by vortex to separate the plaque from acrylic resin block and acrylic resin block was taken out. The mixture was centrifuged at 13000 rpm for 30 sec to remove supernatant. To lyse cells, 50 μL of pre-buffer and 3 μL of lysozyme were added to the tube and mixed well. The mixture was incubated at 37℃ for 15 min and mixed well by pipetting 3 times every 5 min. Then, 250 μL of G-buffer solution was added and mixed gently by pipetting at least 10 times. This step conduced to pass efficiently cell lysates through a column and increase gDNA binding onto column resins for efficient deproteinization. The sample was applied to G-spin column and centrifuged at 13,000 rpm for 1 min. After centrifugation, the collection tube was removed from column and filtrate was discarded. To wash, 500 μL of washing buffer A was added to column. The column was centrifuged at 13,000 rpm for 1 min. After centrifugation, the collection tube was removed from column and filtrate was discarded. The column was placed back in the same collection tube. 500 μL of washing buffer B was added to column. The column was centrifuged at 13,000 rpm for 1 min. The column was centrifuged at 13,000 rpm for an additional 1 min to dry the filter membrane. The column was placed into a 1.5 mL micro centrifuge tube. To elute DNA, 100 μL elution buffer was added to the center of the column. The column was incubated at room temperature for 1 min and centrifuged at 13,000 rpm for 1 min. The extracted DNAs were stored at -20℃ utill use.
3. Quantitative real-time PCR
The numbers of colony forming unit (CFU) were obtained by plating culture dilutions on Brain heart infusion (BHI) agar plates (Difco Laboratories, Detroit, USA)[16,17]. After confirming the number of CFU (108 CFU/mL), serial dilutions of the Streptococcus mutans , Streptococcus sobrinus , and Lactobacillus spp . suspension were produced.
Streptococcus mutans ATCC 25175, Streptococcus sobrinus B-13, and Lactobacilli acidophilus. ATCC 4355 were the bacterial strains used for the standard curve values of each respective strain. The sequences of primers used are listed in Table 3[18-20]. Genomic DNA from each sample was subjected a quantitative real-time polymerase chain reaction (qRT-PCR) assay using the ABI PRISM 7500 system (Applied Biosystems, California, USA) for quantitative detection of target bacteria: Oral bacteria, S. mutans , S. sobrinus and Lactobacillus spp .
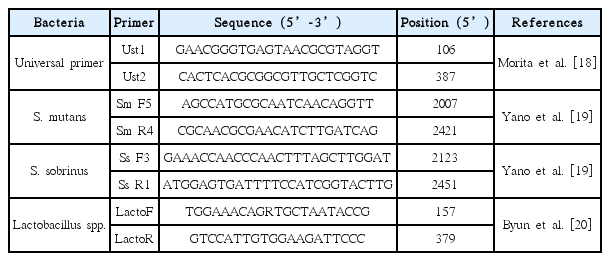
Primers used in this study
Each reaction contained a total of 20 μL of mixture, which included 10 μL of Power SYBR Green PCR master mix (TOPreal ™ qPCR 2X PreMIX: Enzynomics, Daejeon, Korea), 1 μL of DNA extracted from samples, 1 μL of each of the two primers (10 pmol/μL) and 7 μL of nuclease-free water. The temperature was as follows: 10 min at 95℃ for activation, denaturation followed by 40 cycles for 15 sec at 95℃, primer annealing and extension for 1 min at 64℃ for S. mutans and S. sobrinus as well as at 62℃ for Lactobacillus spp . Data acquisition and subsequent analysis were performed using 7500 Software version 2.0.6 (Applied Biosystems, California, USA). Purification of detectable genomic DNA from all plaque samples was confirmed by universal primers.
4. Statistical analysis
Statistical evaluation was performed using the Kruskal-Wallis test with SPSS version 23.0 (SPSS Inc., Chicago, IL, USA). Statistical significance was set at a 0.05 probability level. The Mann-Whitney test was performed for post hoc comparisons of the groups.
Ⅲ. Results
To determine the linearity and bacterial detection, serially diluted genomic DNA solutions of Streptococcus mutans , Streptococcus sobrinus , and Lactobacillus spp . were amplified by quantitative real-time PCR (Fig. 3).

Standard curves show linearity for these bacteria. The horizontal axis of panels indicates line cell number of Streptococcus mutans , Streptococcus sobrinus , and Lactobacillus spp. The vertical axis indicates the critical threshold cycles (CT). (A) standard curve of Streptococcus mutans , (B) standard curve of Streptococcus sobrinus , (C) standard curve of Lactobacillus spp..
The critical threshold cycle (CT) mean is the cycle at which the fluorescence becomes detectable beyond background. CT is negatively proportional to the logarithm of the initial number of colony forming unit (CFU). The standard curves for each of the bacteria were plotted for each primer set by using CT values obtained from the amplification of genomic DNA extracted.
The number of S. mutans , S. sobrinus , and Lactobacillus spp . in plaque samples of 15 children were determined by conversion of the CT (Table 4). S. mutans , S. sobrinus and Lactobacillus spp were detected in all plaque samples .
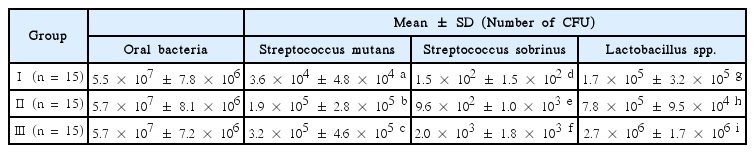
Number of colony forming unit in plaque sample
The number of S. mutans was significant different in pink or red, blue or purple, light blue plaque samples (p < 0.05). Group Ⅰ (3.6 × 10⁴ ± 4.8 × 10⁴) showed the smallest value, followed by group Ⅱ (1.9 × 10⁵ ± 2.8 × 10⁵), and group Ⅲ (3.2 × 10⁵ ± 4.6 × 10⁵) had the largest value (Table 4).
The number of S. sobrinus was also significantly different among pink or red, blue or purple, light blue plaque samples, respectively (p < 0.05). Group Ⅰ (1.5 × 10² ± 1.5 × 10²) showed a lower value than group Ⅱ (9.6 × 10² ± 1.0 × 10³), and group Ⅲ (2.0 × 10³ ± 1.8 × 10³) had showed the highest among the 3 groups (Table 4).
The number of Lactobacillus spp . showed significant difference in pink or red, blue or purple, light blue plaque sample, respectively (p < 0.05). The counts of group Ⅰ (1.7 × 10⁵ ± 3.2 × 10⁵) were significantly lower than group Ⅱ (7.8 × 10⁵ ± 9.5 × 10⁴), and group Ⅲ (2.7 × 10⁶ ± 1.7 × 10⁶) had the highest counts among the 3 groups (Table 4).
In the same color of plaque sample, the number of S. sobrinus showed the smallest value, followed by S. mutans , and Lactobacillus spp . had the largest value.
Ratio of S. sobrinus to S. mutans in dental plaque sample was different in pink or red, blue or purple, light blue plaque sample, respectively. Group Ⅰ (0.4 × 10⁻²) showed a lower value than group Ⅱ (0.5 × 10⁻²), and group Ⅲ (0.6 × 10⁻²) showed the highest value among the 3 groups (p= 0.17) (Table 5).
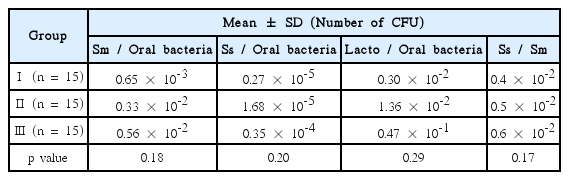
Ratio of colony forming unit in plaque sample
Ratio of S. mutans to oral bacteria in dental plaque sample was increased based on the color of plaque from group Ⅰ to group Ⅲ. Group Ⅰ (0.65 × 10⁻³) showed the smallest value, followed by group Ⅱ (0.33 × 10⁻²), and group Ⅲ (0.56 × 10⁻²) had the largest value (p= 0.18) (Table 5).
Level of S. sobrinus to oral bacteria in dental plaque sample was different based on the color of plaque. Group Ⅰ (0.27 × 10⁻⁵) showed a lower value than group Ⅱ (1.68 × 10⁻⁵), and group Ⅲ (0.35 × 10⁻⁴) showed the highest value among the 3 groups (p= 0.20) (Table 5).
Level of Lactobacillus spp . to oral bacteria in dental plaque sample was increased based on the color of plaque from group Ⅰ to group Ⅲ. The number of Group Ⅰ (0.30 × 10⁻²) showed a lower than group Ⅱ (1.36 × 10⁻²). And group Ⅲ (0.47 × 10⁻¹) had the highest number among the 3 groups (p= 0.29) (Table 5).
Ⅳ. Discussion
In the present study, as dental plaque became more fermentated, the number of Streptococcus mutans , Streptococcus sobrinus , and Lactobacillus spp . was increased based on the color of plaque from group Ⅰ to group Ⅲ. Group Ⅰ (pink or red) showed the smallest value, followed by group Ⅱ (blue or purple), and group Ⅲ (light blue) had the largest value in the number of S. mutans , S. sobrinus and Lactobacillus spp . And ratio of S. mutans , S. sobrinus , Lactobacillus spp . to oral bacteria was increased based on the color of plaque from group Ⅰ to group Ⅲ. This finding confirmed that the different colordyed plaque reflect the pathogenicity associated with cariogenic bacteria.
Recent research on the maturity and the change of bacterial species in biofilm formation indicates that the dental biofilms produce acids from carbohydrates which results in caries formation. Under severe and prolonged acidic conditions, more aciduric bacteria such as S. mutans and Lactobacillus spp . become dominant[21]. Similarly, Duchin et al .[22] showed that plaque from the caries lesions showed markedly elevated levels of S. mutans , as compared to plaque from sound enamel. Boyar and Bowden et al .[23,24] demonstrated that higher levels of S. mutans and Lactobacillus spp . occurred at sites where caries developed. Igrashi et al .[25] concluded that enhanced production of acid observed in the plaque from white spot lesions reflected the presence of highly acidogenic cariogenic bacteria such as S. mutans and Lactobacillus spp . Based on these reports, the development and progression of caries is associated with the number of cariogenic bacteria such as S. mutans and Lactobacillus spp .
The previous study by Jayanthi M et al .[15] had limitation to assess dental caries progression, since Lactobacillus spp ., which is responsible for the progression of caries, was not included. To overcome the limitations of previous study, Lactobacillus spp . was included in the experimental group. In this study, we showed that as dental plaque became more fermentated, the number of Lactobacillus spp . was increased. Thus, 3 tone disclosing gel can be used to assess the risk of dental caries progression.
Clinically, the number of acidogenic bacteria shows highest correlation with children’s dmfs (decayed, missing, filled smooth surface of tooth). Choi EJ et al .[8] reported that children with early childhood caries (ECC) had a significantly higher level of S. mutans in their dental plaque samples. Although S. sobrinus was detected less frequently and in lower numbers than S. mutans , the ratio of S. sobrinus to S. mutans showed highest correlation with children’s dmfs. In our study, as dental plaque became more fermentated, the proportion of S. sobrinus to S. mutans was increased. To examine the relation of these bacteria to caries prevalence and the DMFT index, we should have surveyed the data about the participant’s DMFT count and caries prevalence. Additional supplementation is needed. Group Ⅰ (pink or red) showed the smallest value, followed by group Ⅱ (blue or purple), and group Ⅲ (light blue) had the largest value. The results suggested that a light blue stained plaque is linked with a high possibility of ECC.
Quantitative real-time polymerase chain reaction (qRT-PCR) was used to assess the population of acidogenic bacteria, because it is the most reliable and accurate tool to determine bacterial concentrations in clinical samples.
With qRT-PCR, a broad range of bacterial cells can be measured. The specificity and sensitivity of detection can be provided by specific primers amplifying species-specific target sequence in the PCR[18-20].
A number of clinical chairside tools have been developed to assess the caries risk such as saliva check (Saliva-check mutans: GC corporation, Tokyo, Japan), plaque check (Plaque-check+pH diagnostic kit: GC corporation, Tokyo, Japan), and pH meter (ISFET micro-pH sensor: Horiba, Kyoto, Japan). They are easily accessible but, commercial kits are still expensive. The 3 tone disclosing gel could be used at chair-side, within a clinically acceptable time and at low cost.
Alaluusua and Roeters et al .[26,27] reported that visible plaque of maxillary incisors was strongly associated with the development of caries, and the best indicator of caries risk was visible plaque compared to other potential indicators. Wendt et al .[28] reported that children with no visible plaque at 2 years old had greater chances of remaining free of caries until 3 years old, as compared to children with visible plaque.
Clinically, Real-time caries activity diagnosis at chairside is important to dentists. The results of the present study confirmed the relationship between caries risk, plaque, and cariogenic microorganisms. As per color of plaque, the increasing pathological bacteria counts showed. The 3 tone plaque disclosing gel could be used as one of the indicators to assess the clinical risk of caries associated with the population of S. mutans , S. sobrinus , and Lactobacillus spp . The use of the 3 tone disclosing gel could promote patient education and their motivation for better oral care.
Ⅴ. Conclusion
The relationship between the different color-dyed plaque and the number of acidogenic bacteria was confirmed. The 3 tone plaque disclosing gel could be used as one of the indicators to assess the clinical risk of caries associated with the population of S. mutans , S. sobrinus , and Lactobacillus spp . The use of the 3 tone disclosing gel could promote patient education and their motivation for better oral care.