한 단계 자가부식 접착제를 이용한 복합레진 수복 시 타액오염 후 처치 방법에 따른 미세인장강도 비교
Effect of Saliva Decontamination on Bond Strength of 1-step Self-etching Adhesives to Dentin of Primary Posterior Teeth
Article information
Abstract
이 연구의 목적은 유치에서 한 단계 자가부식 접착제를 이용한 레진수복 시 타액오염 후 처치과정에 따른 미세인장강도를 비교하는 것이다. 건전한 유구치를 접착제 사용에 따라 각각 Scotchbond™ Universal Adhesive (SBU), All-Bond Universal® (ABU), and Tetric® N Bond Universal (TBU)의 3 그룹으로 나누어 무작위로 분배하였다. 각 그룹은 접착제 도포 후 처치과정에 따라 7가지 하위분류로 나누었다. Subgroup I은 대조군으로써, 타액오염 없이 제조사 권고사항에 따라 접착제를 적용하였다. Subgroup II – IV는 접착제 광중합 전에 타액오염을 시행하였고, subgroup V – VII는 접착제 광중합 후에 타액오염을 시행하였다. 그 후 subgroup II, V는 건조, subgroup III, IV는 수세 후 건조, subgroup IV, VII는 수세 후 건조, 그리고 접착제 재도포를 시행하였다.
SBU와 ABU에서 subgroup I, IV, VII의 미세인장강도가 subgroup II, III, V, VI의 미세인장강도보다 유의하게 높았다. TBU에서 subgroup I, IV의 미세인장강도가 subgroup II, III, V, VI의 미세인장강도보다 유의하게 높았다. 이 연구 결과, 임상가는 한 단계 자가부식 접착제를 이용한 레진 수복 시 타액과 수분의 오염으로부터 철저하게 격리를 지켜야 하지만 그럼에도 불구하고 타액오염이 발생하였다면, 수세 및 건조 후 접착제를 재도포할 것을 권장한다.
Trans Abstract
The purpose of this study was to evaluate effect of saliva decontamination procedures on microtensile bond strength (MTBS) of 1-step self-etching adhesives to dentin of primary posterior teeth.
63 sound primary-posterior teeth were randomly divided into 3 groups according to different kinds of 1-step self-etching adhesives: Scotchbond™ Universal Adhesive (SBU), All-Bond Universal® (ABU), and Tetric® N Bond Universal (TBU). Each group was randomly categorized into 7 subgroups: (I) application of adhesive without saliva contamination (control); (II - IV) contamination by saliva before photopolymerization; (V - VII) contamination by saliva after photopolymerization; (II, V) decontamination by drying; (III, VI) decontamination by washing and drying; (IV, VII) decontamination by washing, drying, and reapplication of adhesive. All samples were cut into the blocks. At least 15 blocks were tested for each subgroup.
For SBU and ABU, the MTBS values of subgroups (I, IV, VII) were significantly higher than those of subgroups (II, III, V, VI). For TBU, the MTBS values of subgroups (I, IV) was significantly higher than those of subgroup (II, III, V, VI).
The MTBS of 3 adhesives was reduced by saliva contamination. The adhesive strength on dentin of primary posterior teeth was restored by reapplication of the adhesives after washing and drying.
Ⅰ. Introduction
Isolation from saliva and moisture is considered as an essential step in restoration with composite resin[1]. In pediatric dentistry however, contamination with saliva can occur inevitably because of child’s abrupt movements or improper positioning of rubber dam[2].
1-step self-etching adhesives were introduced to simplify restoration procedures. It would be beneficial for clinicians to perform simplified operation steps[3,4]. However, significant decrease in the adhesive strength on saliva-contaminated dentin surfaces was reported in 1-step self-etching adhesives[3,5,6].
Studies related to saliva decontamination of 1-step self-etching adhesives are controversial. Kim et al . and Ulker et al .[6,7] suggested that washing and drying could restore the adhesive strength to primary dentin when salivary contamination occurs after photopolymerization. Fritz et al .[8] reported the adhesive strength was not restored sufficiently by washing and drying when saliva contamination occurs after photopolymerization.
Santschi et al .[3] reported that low sensitivity to moisture of 1-step self-etching adhesives were originated from hydrophilic molecules such as methacryloyloxydecyl dihydrogen phosphate (MDP) and 2-hydroxyethyl methacrylate (HEMA). The aim of this study was to evaluate the effects of saliva decontamination procedures on microtensile bond strength (MTBS) of 1-step self-etching adhesives with hydrophilic components to dentin of primary posterior teeth.
Ⅱ. Materials and methods
This study was approved by the institutional review board (IRB) of Pusan National University Dental Hospital (IRB No. PNUDH-2016-016).
1. Materials
63 sound primary molars extracted within a month which did not contain caries or restoration materials were selected. They were stored in physiological saline and refrigerated at 4.0° C. The 1-step self-etching adhesives used in this study were Scotchbond™ Universal Adhesive (SBU, 3M, ESPE, St. Paul, MN, USA), All-Bond Universal® (ABU, Bisco Inc., Schaumberg, IL, USA), and Tetric® N Bond Universal (TBU, Ivoclar Vivadent, FL, Schaan, Liechtenstein). Their acidity, composition are summarized in Table 1. The saliva to contaminate the dentin surface was collected from 1 person who had not consumed food during the previous 2 hours. Incremental composite resin restoration was performed with Z-250 (Filtek, 3M ESPE, ST. Paul, Mn, USA). Photopolymerization was performed with LED curing light (VALO®, Ultradent, South Jordan, Utah, USA).
2. Preparation of sample
Self polymerizing resin (Tokuso Curefast, Tokuyama Dental Corp., Japan) was used to fill a 15.0 × 15.0 × 10.0 mm mold, and each tooth was embedded up to the height of the cemento-enamel junction. 63 samples were cut perpendicularly to the long axis with a model trimmer (MT3 Plus Trimmer, Renfert, Hilzingen, Germany) to expose sound dentin. The exposed dentin surfaces were polished with a wet 600 grit silicon carbide abrasive paper. All samples were stored in distilled water at 25.0°C for 24 hours.
3. Classification of subgroups
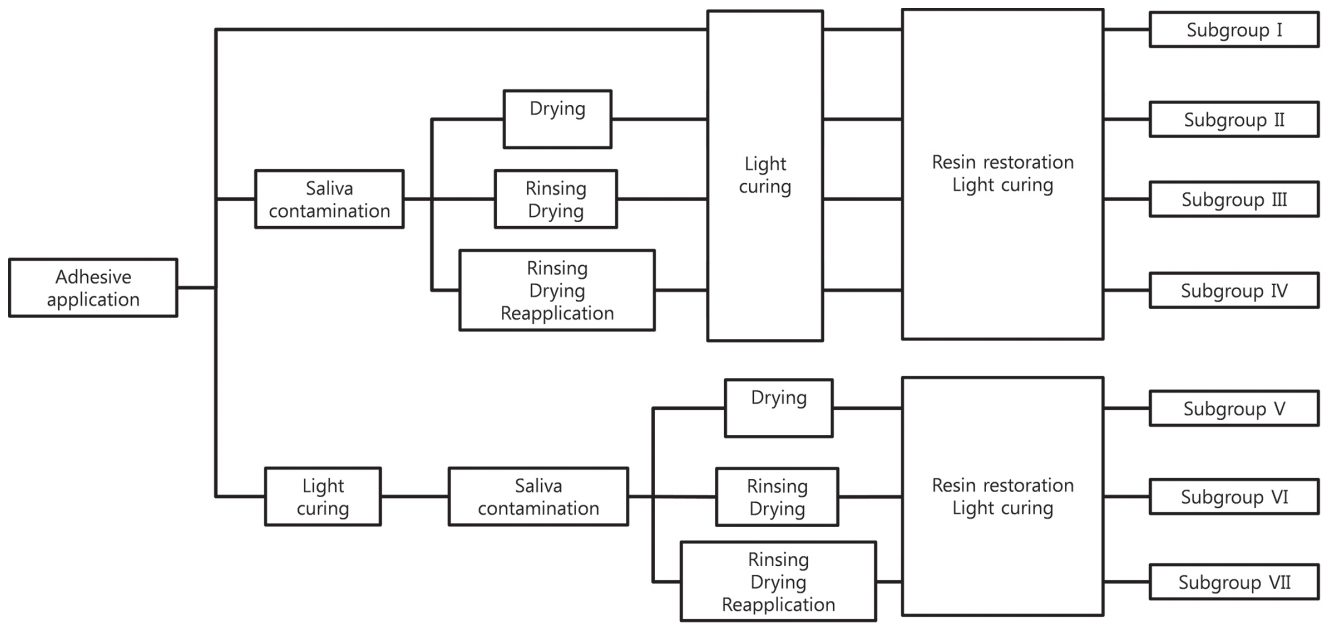
63 samples were randomly divided into 3 adhesive groups. Each group was randomly categorized into 7 subgroups. For subgroup I, the adhesive was applied according to the manufacturer’s recommendations without saliva contamination. For all the other subgroups, the adhesive was applied according to the manufacturer’s recommendations. Samples were contaminated with saliva for 20 seconds either before photopolymerization (subgroups II, III, and IV) or after photopolymerization (subgroups V, VI, and VII). For subgroups II and V, the teeth were dried for 5 seconds. For subgroups III and VI, the teeth were washed for 15 seconds, and dried for 5 seconds. For subgroups IV and VII, the teeth were washed for 15 seconds, dried for 5 seconds, and the adhesive was reapplied. All 7 subgroups were restored with composite resin. The classification of the subgroups and the decontamination procedures are shown in Fig. 1.
4. MTBS measurement and classification of failure modes
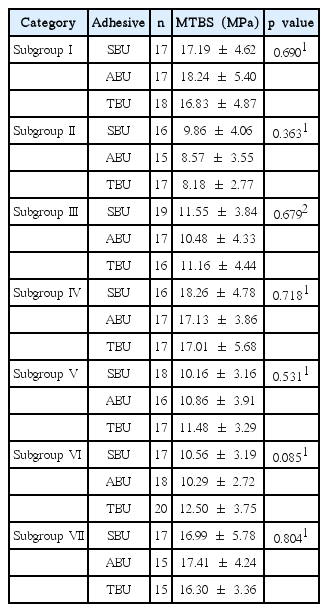
All samples were cut into 1.0 X 1.0 X 10.0 mm³ blocks with a diamond saw (Accustom 50, Struers, Rodovre, Denmark). Damaged blocks during cutting procedure were excluded. The number of specimens for each subgroup is shown in Table 2. At least 15 blocks of each subgroup were prepared and fixed onto an MTBS testing machine (Bisco, Schaumburg, IL, USA) with cyanoacrylate cement (Zapit, Dental Ventures of America, Corona, CA, USA). A tensile load was applied at a rate of 1.0 mm/min. The MTBS and load were measured, when adhesion failed. The failure mode was determined under a stereo-microscope (Leica M320F12, Leica, Heidelberg, Germany) at 40 X magnification. The specimens were examined with scanning electron microscopy (SEM, Hitachi S-3500 N, Hitachi High-Technologies, Wokingham, UK) to observe the debonded interfaces.
5. Statistical analysis
Data were summarized by their mean and standard deviation for numeric variables. Shapiro-Wilk’s test was used to verify the normality of data. Differences among subgroups were analyzed by 1-way ANOVA and Tukey’s post-hoc test for normal data. Kruskal-Wallis test and Dunn’s post-hoc test were used for non-normal data. All statistical analyses were carried out using SPSS 24.0 (SPSS Statistics for Windows 24.0, Armonk, NY, IBM Corp).
Ⅲ. Results
The MTBS was measured for all subgroups. The results for the different adhesives were compared for each subgroup. No significant differences were observed among the adhesives within subgroups that subjected to same decontamination procedure (Table 2, Fig. 2).
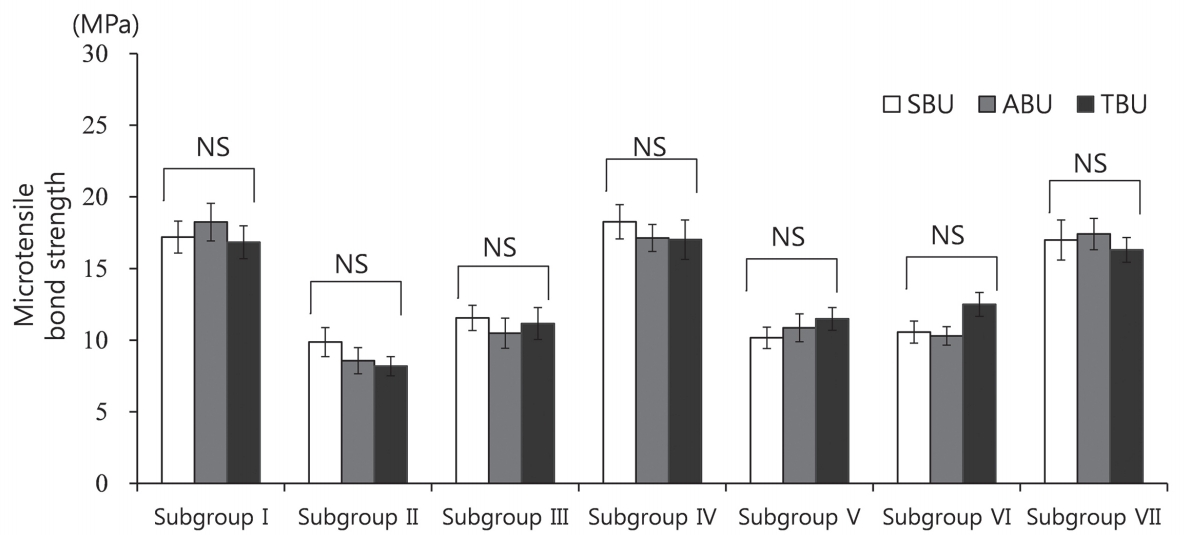
Comparison of the microtensile bond strength values across adhesive groups. SBU = Scotchbond™ Universal Adhesive; ABU = All-Bond Universal®; TBU = Tetric® N Bond Universal, NS = not significant.
The differences in the MTBS values among the subgroups of each adhesive were tested. Significant differences were observed among the subgroups for all 3 adhesives (p < 0.001, Table 3, Fig. 3). In the case of SBU and ABU, the MTBS values of subgroups II, III, V, and VI (contaminated by saliva before or after photopolymerization and decontaminated either drying alone or drying and washing) were significantly lower than those of subgroup I and subgroups IV and VII (contaminated by saliva before or after photopolymerization and decontaminated by washing, drying and reapplication of the adhesives)(p < 0.001). There was no significant difference in the MTBS values of subgroups IV and VII and subgroup I. In the case of TBU, the MTBS values of subgroups II, III, V and VI were significantly lower (p < 0.001) than those of subgroup I and subgroup IV. The MTBS of subgroup VI was lower than that of subgroup VII. However, the difference was not significant. The MTBS of subgroup II was significantly lower than that of subgroup VI.
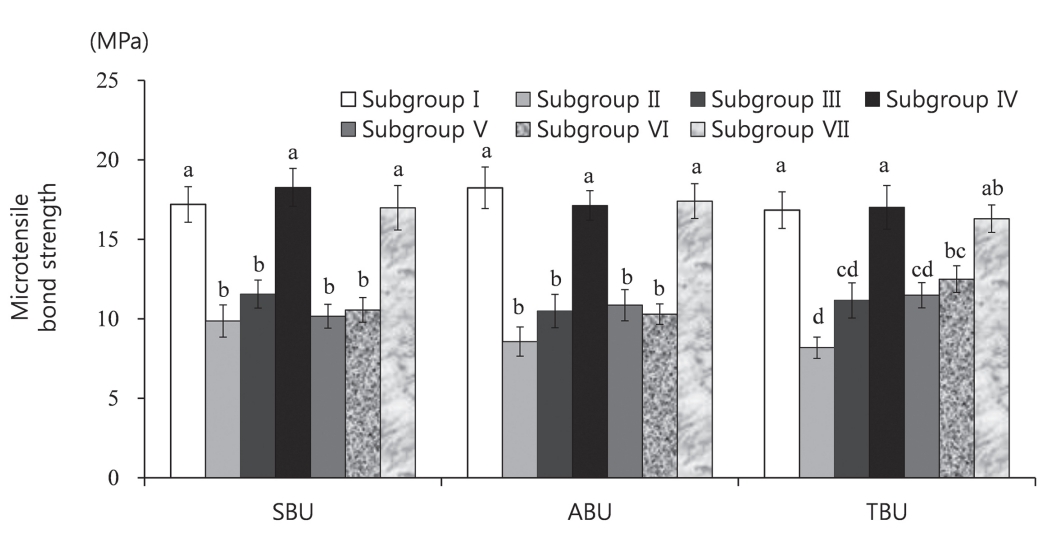
Comparison of the microtensile bond strength values between groups and adhesives. SBU = Scotchbond™ Universal Adhesive, ABU = All-Bond Universal®, TBU = Tetric® N Bond Universal. The superscript letters indicate a significant difference (p < 0.05).
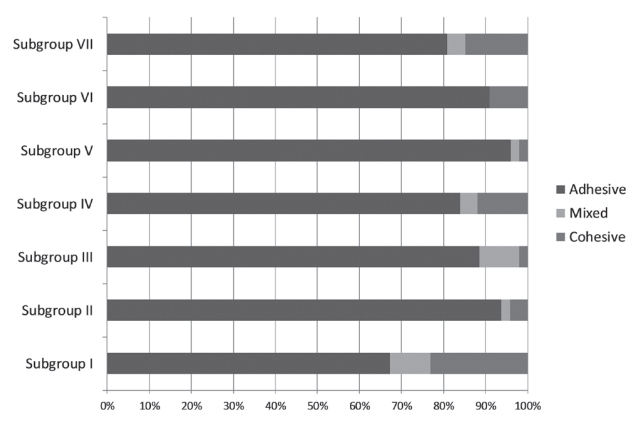
The distribution of failure modes and the percentage of adhesive, mixed, and cohesive failures are shown in Table 4 and Fig. 4.
SEM images of the debonded interfaces were shown in Fig. 5, 6. Adhesion failure was observed at the top of the hybrid layer in subgroup I. In subgroup II, insufficient infiltration into the dentinal tubules and fractures of the resin tags were observed. In subgroup III, insufficient monomer infiltration and demineralized dentin surface were observed. In subgroups IV, V, VI, and VII, failure at the top of the hybrid layer was observed, as in the case of subgroup I. In subgroup VI, multiple voids were observed in the hybrid layer.
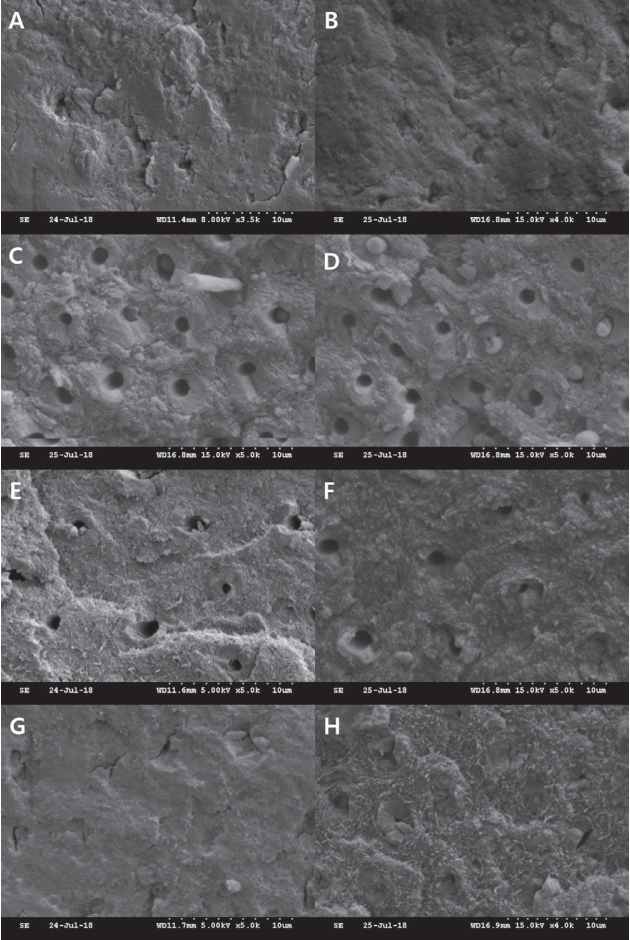
Scanning electron microscope images of the debonded interfaces. (A, B) Subgroup I, fractures occurred at the top of the hybrid layer. (C, D) Subgroup II, insufficient infiltration into the dentinal tubules and fractures of the resin tags were observed. (E, F) Subgroup III, demineralized dentin surface was observed without monomer infiltration. (G, H) Subgroup IV, failure occurred at the top of the hybrid layer.
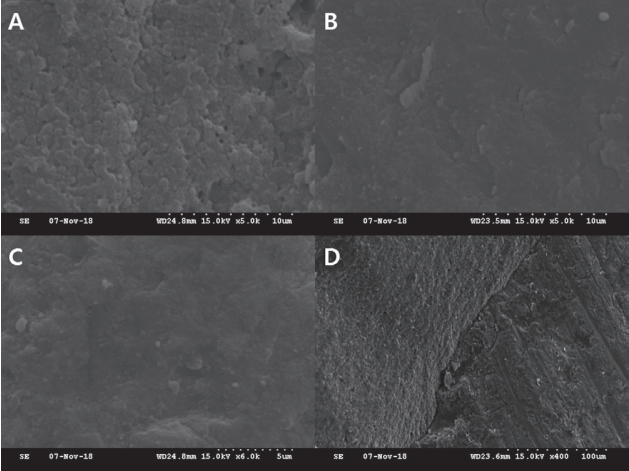
Scanning electron microscope images of the debonded interfaces. (A) Subgroup V, fracture occurred at the top of the hybrid layer and numerous voids are observed. (B) Subgroup VI and (C) subgroup VII, fracture occurred at the top of the hybrid layer. (D) Subgroup VII, cohesive fracture of the composite resin was observed.
Ⅳ. Discussion
In this study, 3 ethanol-based 1-step self-etching which include 10-MDP and HEMA were selected to evaluate the effects of saliva decontaminations on MTBS of 1-step self-etching adhesives to dentin of primary posterior teeth. Santschi et al .[3] reported that the reason for low sensitivity to moisture of 1-step self-etching adhesive was the hydrophilic properties of 10-MDP and HEMA. They also suggested that the use of ethanol as a solvent in place of tert-butanol would contribute to the low sensitivity of the adhesive to moisture. Although low sensitivity to moisture is proven in 1-step self-etching adhesives, recommended procedures of decontamination are controversial.
Regardless of the type of adhesives, significant decreases in the adhesive strength were observed in subgroup II (contaminated by saliva before photopolymerization and decontaminated by drying) compared to that of subgroup I. Hitmi et al .[9] reported that water of saliva was spread and remained within the adhesive layer when saliva contamination occurred before photopolymerization. The hydrophilic properties of 10-MDP and HEMA was identified for the reason. The initiation of chain growth during the polymerization was suppressed. Moreover, glycoproteins within saliva compromised copolymerization between the adhesive and composite resin, causing flaws at the interface of the adhesive and composite resin[9]. Only drying as a decontamination procedure was considered as insufficient to eliminate water and proteins on saliva-contaminated dentin surfaces. The adsorbed proteins were associated with polymerization shrinkage, which led to the fractures of the adhesive tags on the dentin surface (Fig. 5C, 5D). Significant decrease in the adhesive strength between the primary dentin and composite resin was attributed to remained water and proteins.
The MTBS value of subgroup III (contaminated by saliva before photopolymerization and decontaminated by washing, drying) was significantly lower than that of subgroup I. Yoo et al .[5] suggested that the adhesive layer was removed during washing and drying, exposing the dentin surface with insufficient monomer infiltration. Because the 1-step self-etching adhesives contain multiple hydrophilic molecules such as 10-MDP and HEMA, the adhesive layer could be easily removed by washing. Insufficient monomer infiltration into the dentinal tubules and a demineralized dentin surface were observed in SEM images (Fig. 5E, 5F). As a result, the adhesive strength in subgroup III was decreased significantly.
For all 3 adhesives, the MTBS value of subgroup V (contaminated by saliva after photopolymerization and decontaminated by drying) was significantly lower than that of subgroup I. As glycoproteins in saliva was adsorbed in the oxygen-inhibited layer which contains unreacted polymers, the close contact between the adhesive and composite resin was disrupted[8,10,11]. The result of this study assured that only drying for salivacontaminated surface was insufficient to remove the adsorbed glycoproteins. Multiple voids in the adhesive layer caused by water and proteins were observed in SEM images (Fig. 6A). The absorbed glycoproteins were considered as a dominant contributor for the decrease of the adhesive strength.
For all 3 adhesives, the MTBS value of subgroup VI (contaminated after photopolymerization and decontaminated by washing and drying) was significantly lower than that of subgroup I. The unpolymerized surface layer was removed during washing and drying. The hydrophilic molecules would be remained in the oxygen-inhibited layer as unreacted polymers, which can contribute to the loss of the oxygen-inhibited layer during washing and drying. As a result, the adhesion between the adhesive-composite resin was interrupted.
In contrast to the results in SBU and ABU, no significant difference in the adhesive strength was found between subgroups VI and VII in the case of the TBU. As the adhesive strength of subgroup VI in TBU was significantly lower than that of the subgroup I, this difference was not interpreted as important.
For all 3 adhesives, the MTBS value of subgroup IV (contaminated by saliva before photopolymerization and decontaminated by washing, drying and reapplication of the adhesives) was restored on a level with that of subgroup I. The availability of adhesive reapplication was confirmed by multiple studies[12-14]. It is considered that the loss of the adhesive layer and exposure of the demineralized dentin surface during washing and drying could be retrieved by the reapplication of the adhesives. In SEM images of subgroup IV, failure of bonding was observed at the top of the hybrid layer, as in the case of subgroup I (Fig. 5G, 5H).
For all 3 adhesives, the MTBS value of subgroup VII (contaminated after photopolymerization and decontaminated by washing, drying and reapplication of the adhesives) was restored on a level with that of subgroup I. Probable reasons for recovered bond strength could be that the oxygen-inhibited layer removed during washing and drying was generated again by reapplication of the adhesive. In SEM images, fractures were observed at the top of the adhesive layer, similar to the debonded interface observed in the subgroup I. The proportion of adhesive failure was the least among all the experimental groups except for the control group. It is considered that the adhesive strength would be restored by reapplication of the adhesives (Fig. 4, 6C, 6D).
It was reported that the clinically acceptable MTBS for adhesives is 15.0 to 20.0 MPa or more[15]. For all the 3 adhesives, the mean MTBS values were less than 15.0 MPa in subgroups II, III, V, VI. In subgroup I, IV and VII, the mean MTBS values were between 15.0 and 20.0 MPa. Clinically sufficient adhesive strength was obtained from subgroups I, IV and VII. In contrast to the claim insisted by manufacturer that 1-step self-etching adhesives are less sensitive to moisture contamination, the MTBS values were notably decreased when saliva contamination occurred before and after photopolymerization. Therefore, it is recommended that the fields should be isolated completely from saliva and water for restoration of composite resin. If saliva contamination occurs inevitably before or after photopolymerization, the adhesives should be reapplied after washing and drying.
Ⅴ. Conclusions
Within the limitations of this laboratory study, the adhesive strength was not restored significantly by decontamination procedures such as drying only or washing and drying. The adhesive strength was restored significantly by reapplication of the adhesives after washing and drying. These results were of particular interest because manufacturer claimed that 1-step self-etching adhesives were less sensitive to moisture. Although complete isolation from saliva and water during restoration of composite resin is indispensable, reapplication of 1-step self-etching adhesives after washing and drying is recommended when contamination by saliva occurred inevitably in the fields.

