


Ⅰ. Introduction
Accurate and early detection of carious lesions is of paramount importance in treatment decision making and in implementing preventive strategies[1]. However, early detection of proximal caries is difficult as contact points impede direct visualization of initial lesions[2]. Especially in primary teeth, thinner enamel and dentine thickness, less mineralization and wider contact points all attribute to rapid progression of proximal caries that are left undetected until marginal ridges breakdown and become clinically cavitated[3-6].
Conventional diagnostic methods for proximal carious lesions in primary molars include visual-tactile inspection and bitewing radiography. Although these methods provide good overall performance with high specificity, visual inspection has relatively low sensitivity (0.274 - 0.543)[7,8]. Bitewing radiography is often used in conjunction with visual-tactile inspection, but American Dental Association (ADA) guideline restricts its use for screening purposes as it inevitably exposes patients to ionizing radiation[9].
Quantitative light-induced fluorescence (QLF) technology is a non-invasive, optical method for detection and quantitative assessment of carious lesions[10]. It utilizes 405 nm visible blue light irradiated on tooth surface and measures fluorescence loss and red autofluorescence emitted as a result of mineral loss and bacterial metabolites on carious lesions. Since it was first introduced in 1980s, it has undergone series of developments with improved filters and capturing methods for better clinical applications[11]. The pen-type QLF device has been used as an adjunct method for caries detection but there are still no studies that assess the clinical performance of the device in detecting proximal caries in primary dentition.
The aim of this in vivo study was to evaluate the screening performance of the pen-type QLF device in detecting proximal carious lesions in primary molars using fluorescence loss, red autofluorescence and a simplified QLF score for proximal caries suggested by Kim et al.[12], compared to bitewing radiography.
Ⅱ. Materials and Methods
1. Patient selection
This study was approved by the Seoul National University Institutional Review Board (IRB No. S-D20190014). Sixty healthy patients (boys : n = 32, girls : n = 28) aged 3-10 years, who attended Department of Pediatric Dentistry, Seoul National University Dental Hospital for caries evaluation and who required bitewing radiography as a part of their assessment were invited to participate in the study from July 2019 to January 2020. Written consents were obtained from the children’s caregivers. Subjects with systemic disease and those with fixed orthodontic appliances or space maintainers were excluded from the study. Approximal surfaces between primary molars were included in the analysis. Proximal surfaces with restoration, marginal ridge breakdown due to cavitation, with tooth abnormality, that are directly accessible due to open contact were excluded.
2. Visual-tactile examination
Prior to clinical examination, plaque removal with dry gauze and interdental flossing was conducted. Visual-tactile examination was performed using dental mirror and explorer on air dried tooth surfaces. The caries status was recorded according to International caries detection and assessment system II (ICDAS-II) criteria (Table 1) and ranged from V0-V4, V5 being excluded from the study.
3. Radiographic examination
Digital bitewing radiographs of proximal surfaces of primary molars were obtained using CS2200 system (Carestream Health Inc., Rochester, USA) using extension cone paralleling technique. The bitewing radiographs were scored from R0-R5 according to International caries classification and management system (ICCMS, Table 1).
4. QLF image acquisition and evaluation
Normal white-light images and sequential fluorescence images were captured with Qraypen C (AIOBIO, Seoul, Korea) in room light setting on a dental chair. Lips and soft tissues were retracted and images were captured with auto-focus of the device from the occlusal direction of the primary molars.
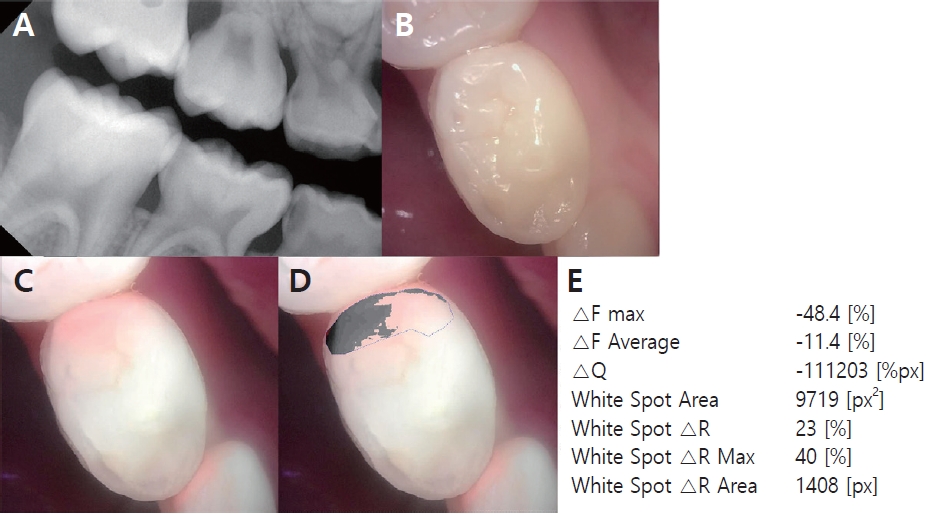
The fluorescence images were analyzed for both quantitative QLF parameters using Q-Ray software (version 1.42, Inspektor Research System BV, Amsterdam, The Netherlands, Fig. 1) and QLF score for proximal caries (QS-Proximal, Fig. 2) as suggested by Kim et al.[12]. For quantitative QLF parameters, fluorescence on marginal ridges of approximal surfaces between primary first and second molars were analyzed for △F, the average fluorescence loss on the carious surface and △R, the red autofluorescence of the carious lesion. The QS-proximal was assessed according to degree of fluorescence loss and red autofluorescence and scored Q0-Q3 according to the severity of the lesion (Table 1).
5. Statistical analysis
SPSS 25.0 (IBM, Chicago, USA) was used for statistical analysis. The median values of quantitative QLF parameters according to lesion severity based on radiographic scores were compared using Kruskal-Wallis test and Mann-Whitney post hoc test. To evaluate the validity of the clinical performance in detecting proximal caries, Spearman’s rank correlation coefficients, sensitivity, specificity, and the area under the receiver operating characteristic curve (AUROC) (95% confidence interval) were determined for all QLF parameters for caries at both enamel (R0/R1-5) and dentine (R0-2/R3-5) level according to radiographic scores. Cross-tabulation was used for analysis of distribution of visual-tactile scores and QLF scores to radiographic scores and the associations between each score to radiographic scores were analyzed by calculation of Spearman’s rank correlation coefficients. To evaluate the performance of QS-proximal in proximal caries detection at dentine level in primary molars, the sensitivity, specificity and AUROC were calculated at Q0/Q1, Q1/Q2, and V3/V4 thresholds. Intra-examiner reliability was determined using Cohen’s unweighted kappa for evaluation of repeatability of QLF scoring system.
Ⅲ. Results
In this study, total of 60 participants aged 3 - 10 years, with mean age of 5.35 were included (boys : n = 32, girls : n = 28). Three hundred forty-four approximal surfaces were evaluated. In total, 92 (26.7%) maxillary first primary molar, 83 (24.1%) maxillary second primary molar, 78 (22.7%) mandibular first primary molar, 91 (26.4%) mandibular second primary molar surfaces were selected.
1. Evaluation of QLF parameters
△F decreased and △R increased as radiographic scores increased (Table 2), and significant differences between △F and △R in respect to radiographic scores are presented in Table 3 and 4. The correlations between △F, △R and the radiographic scores were -0.446 (p=0.000) and 0.546 (p=0.000), respectively. The AUROC values for detecting dentine level caries were fair (△F = 0.794, △R = 0.750, Table 5), with AUROC values for detecting enamel level caries relatively lower (△F = 0.702, △R = 0.631, Table 6).
2. Evaluation of QS-proximal
The intra-examiner reliability of QS-proximal was 0.854 (p=0.000). The distributions of QLF scores and visual-tactile scores in respect to radiographic scores are shown in Table 7. The correlation coefficient for QS-proximal and radiographic scores was 0.712 (p=0.000), which was higher than the correlation coefficient between visual-tactile scores and radiographic scores (0.509, p=0.000). For detecting proximal caries in primary molars, AUROC values for both Q0/Q1 (0.769) and Q1/Q2 (0.757) threshold were fair and were higher than that of visualtactile score at V3/V4 threshold (0.653, Table 8).
Ⅳ. Discussion
The pen-type QLF device used in this study, introduced in 2015, is relatively new in the market and this is the first study to assess its clinical performance in detecting proximal caries in primary dentition. Over the past years, various techniques including electrical conductance, fiber optic transillumination and DIAGNOdent have been developed in search for a more sensitive and accurate caries detection tool[13]. Sensitivities and specificities of these tools show large variations according to a systematic review and most of the results were from in vitro studies on permanent teeth[13]. Primary teeth, however, have different characteristics to permanent teeth requiring new caries detection tools to be tested on primary teeth for validation[14]. In this study, AUROC values for detecting dentine level caries (R0-2/R3-5) were 0.750 - 0.794 using QLF parameters, which suggest fair clinical performance, whereas AUROC values for detecting enamel level caries (R0/R1-5) were lower. In a previous study that assessed screening performance of QLF technology in detecting proximal caries in permanent dentition[12], AUROC values were higher (0.860 - 0.902). However, direct comparison cannot be made as the device used in the study on permanent dentition was QLF-Digital Biluminator 2+ (QLF-D, Inspektor Research Systems BV, Amsterdam, the Netherlands), which is different to the pen-type QLF device used in this study, though they both utilize QLF technology. Also, cut-off value of △F to detect dentine level caries found in this study was -6.15, which is lower than -12.4, the cut-off value suggested for permanent teeth[12]. This difference may be explained by some characteristics of primary teeth, having thinner enamel and dentine layer with lower degree of mineralization than permanent teeth[3,4]. Further evaluation is necessary to determine whether these differences arise from the differences in characteristics of permanent and primary dentition or due to inherent differences of devices.
Compared to visual-tactile inspection, which is used conventionally in conjunction to bitewing radiography to detect proximal caries[8], QLF scores showed higher correlation to radiographic scores. Visual inspection, though it is the most commonly used method of caries detection with high specificity, it has limitations of low sensitivity and reproducibility[15]. Moreover, visual inspection has been reported to be influenced by discomfort reported by pediatric patients, increasing the false-positive results[16]. QLF scores for proximal caries suggested by Kim et al. simplified the QLF analysis process[12], making it possible to assess the lesion severity intuitively without the need for quantitative analysis. QLF scoring system takes both fluorescence loss and red autofluorescence into account, which can be analyzed on QLF images taken with second (QLF-D) and third generation (Qraypen C) QLF devices. Second and third generation QLF devices contain 405 nm peak wavelength of violet blue light LEDs with mounted high pass filter (> 480 nm) with a pink filter to emphasize the 630 - 640 nm band for enhanced red autofluorescence[11]. Red autofluorescence is known to be emitted by bacterial metabolites in carious lesions, such as porphyrin[17]. Previous studies have shown that red autofluorescence is increased in active carious lesions and is associated with caries progression[18,19]. However, red autofluorescence can be detected with other confounding factors, such as plaque and cracks. Hence with thorough cleaning and flossing of tooth surfaces before taking QLF images, the QLF device can be used to detect hidden proximal caries, which otherwise may have been overlooked by visual inspection only. In addition, visualization of bright red color of the hidden carious lesion may help in educating both the patients and caregivers and motivate the management.
Bitewing radiography is often used for diagnosis and as decision criteria for operative treatments in clinical settings[20], so QLF parameters and scores were compared with bitewing radiography to evaluate the clinical performance of the pen-type QLF device. However, radiographs underestimate the lesion depth and do not provide information about the presence of cavitation on the enamel nor the lesion activity[20-22], making it difficult to decide whether to remineralize the lesion or to undergo operative treatment. Temporary separations or operative interventions have been used in other clinical studies as reference standards[23,24], when validating a new diagnostic tool. However, these reference standards also have shortcomings, as temporary separation needs second visit by patients and operative interventions are invasive. Furthermore, in clinical setting, ionizing radiation limits frequent use of bitewing radiography and this method cannot be used for screening or monitoring purposes, requiring an adjunct diagnostic method. The AUROC value for QLF scoring showed fair results of 0.757 - 0.769 in detecting dentine level caries, which was higher than that of visual score (0.653). As QLF technology is non-invasive using only visible light, it can be used frequently without causing any harm to the patients. QLF images can be used as an adjunct tool for screening purposes prior to radiographic examinations and to monitor proximal caries during follow-up visits.
The QLF images used in this study were taken from the occlusal direction of primary molars. Previous in vitro studies suggested viewing from bucco-lingual direction gives more sensitive results in detecting proximal caries[25,26], as marginal ridges above proximal carious lesions mask the fluorescence detected by the QLF device[27]. Also, this viewing direction was different from the bucco-lingual viewing direction of bitewing radiography, which remains as a limitation of this study. Further studies are required to evaluate the relationship between the marginal ridges above the proximal carious lesions and detecting ability of the QLF device.
Early and accurate diagnosis of dental caries is important, especially in children with primary dentition, to spare patients from discomforts of advanced lesions and some operative procedures. The QLF technology can be used to detect and monitor approximal carious lesions that are difficult to detect with visual examinations only. In Korea, the pen-type QLF device was announced as a New Health Technology in 2018 by Ministry of Health and Welfare and its clinical use is covered by the National Health Insurance from 1st June, 2021. As the device show overall fair clinical screening performance in detecting proximal caries in primary molars, it can be used as decision criteria before prescribing bitewing radiography to minimize pediatric patients from exposure to ionizing radiation. Also, with enhanced visualization of red autofluorescence in QLF images, patient and caregiver education may be conducted effectively.
Ⅴ. Conclusion
The pen-type QLF device exhibited fair clinical screening ability of detecting proximal caries in primary molars. QLF parameters showed better performance in detecting dentine level caries than enamel level caries and using QLF scores were superior in detecting proximal caries than using visual scores, when compared to bitewing radiography.

 PDF Links
 PubReader
 Full text via DOI
 Download Citation
 Print
Print