혼합치열과 영구치열 환자를 대상으로 한 웹 기반 인공지능 두부 계측 분석에서의 비교 검증
Comparative Validation of the Mixed and Permanent Dentition at Web-Based Artificial Intelligence Cephalometric Analysis
Article information

Abstract
이 후향적 연구의 목적은 7 - 15세 사이의 혼합치열기와 영구치열기의 소아 및 청소년 환자에서 기존 교정 분석 방법과 인공 지능을 활용한 교정 분석 방법을 이용한 변수의 차이를 비교하여 평가하는 것이다.
교정 진단을 위해 측면 두부계측 방사선 사진을 촬영한 소아 환자 60명(혼합 치열기 30명, 영구치열기 30명)을 무작위로 선정하였다. V-ceph을 사용한 기존 분석 방법과 WebCeph를 사용한 딥 러닝 기반 분석 방법으로 1명의 검사자가 17개의 두부 측정 계측점을 식별하고, 22개의 측정 항목을 평가했다. 기존 분석 방법의 반복 측정으로 인한 오차는 Pearson의 상관 분석을 사용하여 평가하었다. 혼합치열군과 영구치열군에 대한 각각 두 방법의 차이는 paired t-test를 사용하여 평가하였다.
혼합치열군에서 두 분석 방법의 차이는 8개의 계측항목에서 통계적으로 유의하였다: APDI, SNA, SNB, Mandibular plane angle, LAFH (p < 0.001), Facial ratio (p = 0.001), U1 to SN (p = 0.012), and U1 to A-Pg (p = 0.021). 영구치열군에서는 두 분석 방법 간에 4개의 계측항목이 통계적으로 유의한 차이를 보였다: ODI (p = 0.020), Wits appraisal (p = 0.025), Facial ratio (p = 0.026), and U1 to A-Pg (p = 0.001).
많은 시간이 소요되는 기존의 교정 분석 방법과 비교하였을 때, 딥 러닝 기반 교정 분석 시스템은 측정의 신뢰성과 유효성 측면에서 임상적으로 허용될 수 있다. 하지만 소아 환자의 교정 분석을 위해 딥 러닝 기반 프로그램을 사용할 때에는 이러한 프로그램의 한계점을 인지하고 올바른 판단으로 사용하는 것이 중요하다.
Trans Abstract
This retrospective study aimed to evaluate the difference in measurement between conventional orthodontic analysis and artificial intelligence orthodontic analysis in pediatric and adolescent patients aged 7 - 15 with the mixed and permanent dentition.
A total of 60 pediatric and adolescent patients (30 mixed dentition, 30 permanent dentition) who underwent lateral cephalometric radiograph for orthodontic diagnosis were randomly selected. Seventeen cephalometric landmarks were identified, and 22 measurements were calculated by 1 examiner, using both conventional analysis method and deep learning-based analysis method. Errors due to repeated measurements were assessed by Pearson’s correlation coefficient. For the mixed dentition group and the permanent dentition group, respectively, a paired t-test was used to evaluate the difference between the 2 methods.
The difference between the 2 methods for 8 measurements were statistically significant in mixed dentition group: APDI, SNA, SNB, Mandibular plane angle, LAFH (p < 0.001), Facial ratio (p = 0.001), U1 to SN (p = 0.012), and U1 to A-Pg (p = 0.021). In the permanent dentition group, 4 measurements showed a statistically significant difference between the 2 methods: ODI (p = 0.020), Wits appraisal (p = 0.025), Facial ratio (p = 0.026), and U1 to A-Pg (p = 0.001).
Compared with the time-consuming conventional orthodontic analysis, the deep learning-based cephalometric system can be clinically acceptable in terms of reliability and validity. However, it is essential to understand the limitations of the deep learning-based programs for orthodontic analysis of pediatric and adolescent patients and use these programs with the proper assessment.
Ⅰ. Introduction
Early diagnosis and treatment of malocclusion in mixed dentition is one of the important topics in pediatric dentistry. Lateral cephalometric radiography is an essential element in evaluating the cause of malocclusion by determining the relationship between the teeth, skeleton and soft tissue[1]. The pediatric dentist’s judgment is important in establishing a treatment plan and recognizing patients’ needs. These orthodontic treatment decisions may vary between pediatric dentists due to differences of opinion. Clinicians with less experience have trouble making the right decision[2].
Manual tracing is time-consuming and comes with a high risk of misreading values. Manual tracing is susceptible to error in landmark identification due to radiographic film magnification[3,4]. Manual tracing has been replaced by digital tracing gradually. Computer-assisted orthodontic analysis, such as VCeph (Osstem, Seoul, Korea), FACAD (Ilexis AB, Linköping, Sweden), and Dolphin (Dolphin Imaging, Chatsworth, CA, USA), has many advantages: the ease of use, unnecessariness of hard copies, and modification of digital images[5]. In spite of these advantages, several factors influence the selection of software, such as the complexity of installation procedures, high subscription and update cost, and the significant effort required to master the training software[6].
According to recent studies, the clinical adaptation of deep learning models has shown outstanding performance in dentistry[7,8]. Many algorithms have been developed to automatically detect cephalometric landmarks for orthodontic analysis through various artificial intelligence models[9-11]. Previous studies showed the accuracy and reperoducibility of landmark identification using artificial intelligence[6,10,11]. Although few studies have evaluated angular and linear measurements due to the difficulty of analyzing the reproducibility of lines and angles, evaluation of a new diagnostic system is important to assess whether it provides immediately useful results for treatment planning[12].
WebCeph (Assemblecircle, Seoul, Korea) is an orthodontic analysis platform and web-based cloud system that clinicians are available free of charge. It can save patient records, predict outcomes after orthodontic treatment, and perform cephalometric analysis using deep learning-based algorithms. WebCeph is a system developed by image training a deep learning model for adult patients with permanent dentition, and its effectiveness is reported in orthognathic surgery and adult orthodontic diagnosis[2]. However, there are insufficient studies to evaluate the accuracy of orthodontic analysis programs based on deep learning models in children and adolescents.
This study aims to validate the reliability of the application of WebCeph, a clinically acceptable deep learning-based system in adult patients, to children and adolescents without fine tuning. This study focused on whether these data were clinically useful for adolescent patients by evaluating 22 cephalometric measurements obtained through both conventional and deep learning-based methods.
Ⅱ. Materials and Methods
This retrospective study was conducted at Ewha Womans University Mokdong Hospital. The study was approved by the Institutional Review Board (IRB) of the hospital (IRB No. 2021-03-029-003) prior to the study.
1. Study population
The subjects were 60 pediatric and adolescent patients aged 7 - 15 years for orthodontic diagnosis between 2013 and 2019. Patients were randomly selected for this retrospective study and consisted of 30 patients with mixed dentition and 30 patients with permanent dentition. The average age of the mixed dentition group was 8.33 years (range, 7 - 11 years) and the permanent dentition group was 12.67 years (range, 11 - 15 years). The percentage of men and women was equally distributed in both groups. The exclusion criteria were specified as follows: unerupted or missing incisors and first permanent molars, unerupted teeth overlying the incisors’ apices, malformed teeth, maxillofacial deformities, and severe skeletal deformations.
All cephalometric radiographs used in this study were obtained from subjects for orthodontic diagnosis prior to orthodontic treatment. The cephalometric radiographs were obtained with the following specifications: dose, 15 mAs; tube voltage, 80 - 90 kV; scanning time, 0.6 - 1.0 sec; and field of view, 20.1 × 25.2 cm. Cephalometric radiographs were downloaded from an imaging system (INFINITT Dental PACS; Infinitt, Seoul, Korea) and stored as DICOM files for V-Ceph and JPEG images for WebCeph. The original image was 2,510 × 2,000 pixels with 300 dpi resolution.
2. Study design
1) Evaluation of the Cephalometric radiograph using conventional tracing
All 60 cephalometric radiographs were traced by 1 pediatric dentist using V-Ceph version 7.0 (Osstem, Seoul, Korea) and retraced by the same examiner 2 weeks later for the intraexaminer reproducibility. Landmark identification for cephalometric analysis was performed manually on the digital image with a mouse-controlled cursor by the examiner. A total of 17 landmarks were defined on each cephalometric radiograph and 22 selected skeletal and dental parameters were measured (Table 1).

Cephalometric measurements used in this study
2) Evaluation of the Cephalometric radiograph using deep learning-based programs
An individual account was created on the WebCeph website for this study. The cephalometric radiographs were uploaded to the WebCeph website and traced by the website within a few seconds. The actual size of each image was calibrated by measuring the known distance (20.0 mm) between 2 points in the digital cassette using the WebCeph ruler on the uploaded image screen. This calibration was standardized all cephalometric images. Images were traced automatically by the deep learning-based program, and the examiner did not modify the orthodontic analysis results. All measurements were obtained from the WebCeph database for each image.
3. Statistical analysis
The mean differences and standard deviation of the differences between the repeated measurements for each patient group were calculated. The intra-examiner reproducibility was evaluated by the Pearson’s correlation coefficient. Systematic errors were calculated by paired measurement comparisons of conventional and deep learning-based tracings by paired t-test, respectively, for the mixed and permanent dentition groups. The data were analyzed by IBM SPSS Statistics software (ver. 22.0, SPSS Inc., Chicago, IL, USA).
Ⅲ. Results
1. Reliability of repeated conventional tracing in the mixed and permanent dentition groups
Table 2 gives the reliability of repeated measurements by a single examiner for the conventional tracing. In general, the correlation coefficients of all measurements in both mixed and permanent dentition groups were above 0.9 (strong correlation), except LAFH, which had a correlation of 0.82 for the mixed dentition group. As indicated by the correlation coefficients in both groups, intra-examiner reproducibility was high, and the reliability of repeated measurements was good.

Reproducibility of repeated measurements using a conventional analysis method in the mixed and permanent dentition groups (inter-examiner error)
2. Measurement differences between conventional analysis and deep learning-based cephalometric analysis in the mixed and permanent dentition groups
Table 3 shows the measurement differences between the conventional and deep learning-based methods in the mixed dentition group. Statistically significant differences were detected for APDI, SNA, SNB, Mandibular plane angle, LAFH, Facial ratio, U1 to SN, and U1 to A-Pg. The measurement differences between the 2 methods in the permanent dentition group are reported in Table 4. In general, the magnitude of the difference between sample means was small. Only 4 measurements (ODI, Wits appraisal, Facial ratio, and U1 to A-Pg) have statistically significant differences.
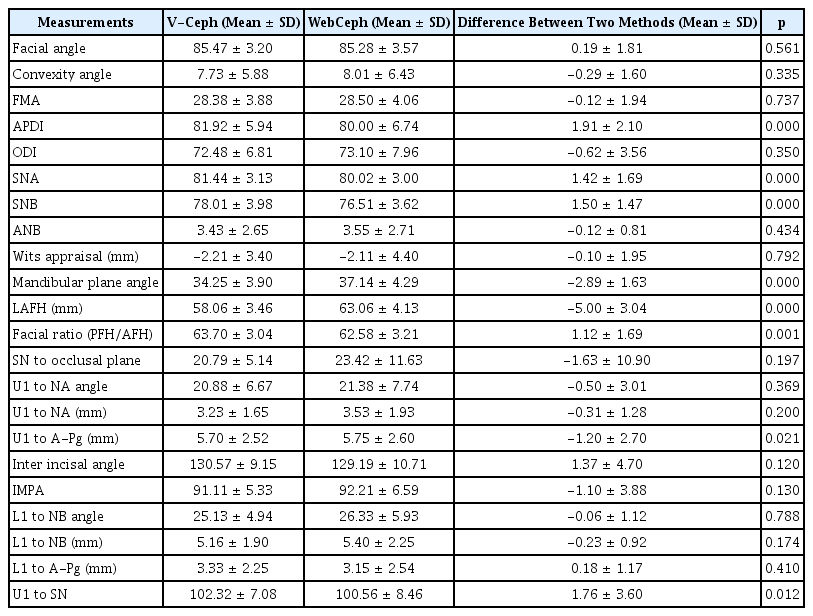
Measurement differences between conventional and deep learning-based cephalometric analysis in the mixed dentition group
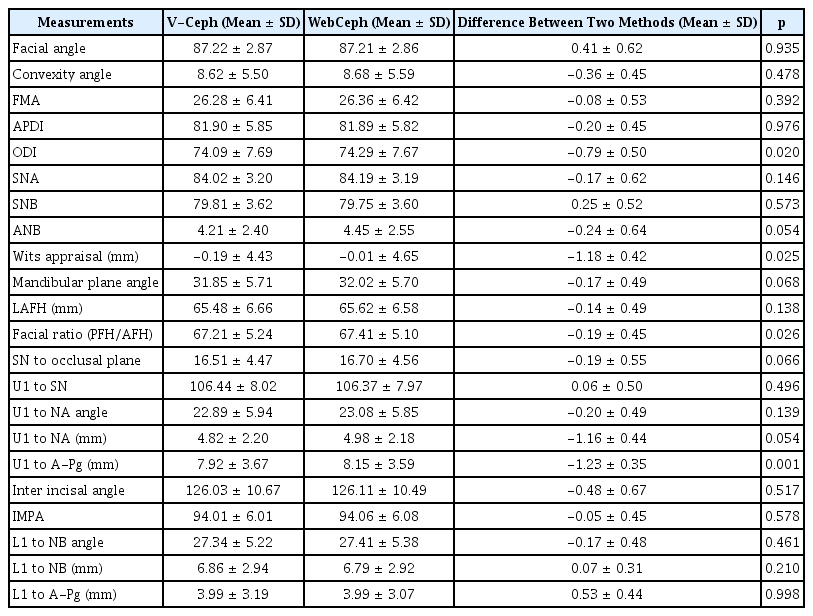
Measurement differences between conventional and deep learning-based cephalometric analysis in the permanent dentition group
Ⅳ. Discussion
Lateral cephalometric image analysis was first introduced by Broadbent[13] in 1931. It has been used as a tool for diagnosing malocclusion, treatment planning, a growth pattern, and treatment outcome analysis. In the past, anatomical landmarks were manually traced on cephalometric radiographs. Despite being the most important procedure in cephalometric analysis, landmark identification is error-prone and time-consuming[14]. After the introduction of computer-aided analysis, cephalometric analysis using deep learning models was developed.
Deep learning algorithms use convolution filters and pooling layers to extract characteristics from images and analyze patterns. Many deep learning models have been enhanced by improving filter sizes, various ideas, and locations. The convolutional neural network, a deep neural network with multiple hidden layers, is a suitable structure for learning 2-dimensional images, such as cephalometric radiographs. These algorithms are useful for less experienced clinicians as they provide consistent results of landmark detection and measurement analysis[2]. The previous studies only investigated the accuracy of orthodontic diagnosis in patients with permanent teeth using artificial intelligence-based algorithm[6]. It is meaningful to conduct a study on the reliability of deep learning-based orthodontic analysis systems in young patients with the mixed dentition and permanent dentition.
WebCeph is a program recently developed in Korea through deep learning training of Korean adult orthodontic patients. After receiving a lateral cephalometric radiograph as input, in step 1, WebCeph detects the lateral facial region using the Support Vector Machine for the Histogram Oriented Gradients processed image. In step 2, landmarks are detected using the Ensemble of Regression Tree algorithm and the Gradient Boosting Algorithm for the detected lateral facial region. In step 3, using Faster R-CNN (ResNet), it is designed to detect a more precise location around the detected landmark location[15].
In this study, this program was chosen from among several deep learning-based programs to evaluate the accuracy of cephalometric measurements in children and adolescents. WebCeph is now free of charge, and clinicians can easily access it from mobile and computers in 22 languages. If the accuracy of the orthodontic analysis in both pediatric and adolescent patients is proven, it will help clinicians in actual clinical practice.
According to previous studies, the differences between manual and digital tracing methods were not clinically significant, and both methods were reliable[6,16]. This study evaluated the reliability by comparing deep learning-based tracing and digital tracing as a conventional method. The measurements repeated with the conventional digital cephalometric method showed high reproducibility in both groups (Table 2). This data showed the examiner could accurately reproduce measurements, and there was no difficulty in identifying the landmarks equally. These results correspond with previous studies that showed high reliability of the repeated measurements[12,17,18]. In this study, 2 repeated measurements were obtained to evaluate the reliability of the examiner based on the previous research method[12]. However, a more accurate assessment of intra-observer reliability can be obtained if repeated measurements were performed 3 times.
The influence of examiner’s clinical experience on landmark identification is significant along with the tracing method itself. In general, it is known that inter-examiner errors more frequently occur than intra-examiner errors[19]. Therefore, all measurements in this study were obtained by 1 examiner to minimize these errors. However, limitations to the reliability of the results may exist depending on a single examiner’s experience and proficiency. Thus, more reliable study results can be obtained by comparing 3 repeated measurements by 2 or more proficient examiners.
Table 3 shows the comparison results between the measurements of 2 methods by paired t-test in the mixed dentition group. The statistically significant differences between the 2 methods were detected in 8 of the 22 cephalometric variables (APDI, SNA, SNB, Mandibular plane angle, LAFH, Facial ratio, U1 to SN, and U1 to A-Pg). The comparison between the measurements of 2 methods in the permanent dentition group is shown in Table 4. In the permanent dentition group, there were no statistically significant difference between the 2 methods in most measurements, except for APDI, Wits appraisal, Facial ratio, and U1 to A-Pg.
The measurements that showed a significant difference in both groups were Facial ratio and U1 to A-Pg. Facial ratio, which is defined as the ratio percent of PFH (S - Go) and AFH (N - Me), is considered to be associated with difficulties in landmark identification itself. Differences in landmark identification used in combination of gonion and menton, which are difficult to detect, might increase the magnitude of the discrepancy. According to previous studies, the uncertainty in detecting the menton point may be caused by the difficulty of locating a landmark on curved anatomical boundaries[17]. The gonion point is defined by bisecting the angle to the tangent to the mandibular plane and the posterior border of the ramus. The detection of this landmark is difficult because it corresponds to an incorrectly defined outline related with bilateral anatomic structures and often projecting as overlapping image[12,17].
U1 to A-Pg, a variable associated with the maxillary incisors, A point and pogonion, is another measurement that showed a significant difference between 2 methods in both groups. In previous studies, it was reported that the tracing of incisor location was difficult and the incisor angular measurement was likely to change depending on the tracing methods[14,20,21]. As the A point is known to have poor reproducibility, in children with mixed dentition, locating A point may be more difficult because the image is blurred and overlaps due to the presence of tooth germs in the maxillary anterior region[12].
The number of measurements showing a statistically significant difference between the 2 methods was observed more in the mixed dentition group than in the permanent teeth group (8 measurements in the mixed dentition group, 4 measurements in the permanent dentition group). Fig. 1 is an example of the differences between WebCeph and V-Ceph program in landmark identification of a patient with mixed dentition. The radiographs traced by two methods were superimposed. Although the detection of landmarks was within the error range of 2 mm, reported as clinically acceptable in previous studies[10,11], the angular or linear measurements composed of a combination of landmarks may have a larger error due to the summation of the errors. Comparing the measurements showing a significant difference in the 2 groups, the measurements related to the identification error of nasion (N) are observed in the mixed dentition group. Previous research has indicated that it is difficult to identify nasion (N) when the nasofrontal suture is not accurately visualized, suggesting the possibility of such errors[22].

Differences between the 2 methods in landmark identification of a patient with mixed dentition. While the yellow dots are landmarks detected by the deep learning-based WebCeph program, the red dots are landmarks detected by the conventional V-Ceph program.
1 = Sella Turcica, 2 = Nasion, 3 = Orbitale, 4 = Porion, 5 = Anterior nasal spine, 6 = Posterior nasal spine, 7 = A point, 8 = B point, 9 = Upper incisor edge, 10 = Upper incisor apex, 11 = Lower incisor edge, 12 = Lower incisor apex, 13 = Pogonion, 14 = Gnathion, 15 = Menton, 16 = Gonion, 17 = Articulare
Since WebCeph is a deep learning model trained only on adult with permanent teeth, errors may occur in cephalometric measurements for pediatric and adolescent patients. It would have been difficult to accurately detect skeletal and dental measurements on cephalometric radiographs of patients with mixed dentition. The performance of a diagnostic system could be improved by fine-tuning existing deep learning models[23]. Developing a fine-tuned deep learning-based cephalometric system for patients with mixed dentition could provide more accurate analysis results.
In a previous study, Alqahtani[6] compared measurements obtained from the analysis of the computer program FACAD® (Ilexis AB, Linköping, Sweden) and that of the deep learningbased algorithm CephX® (CephX Inc., Las Vegas, USA). Alqahtani found statistically meaningful differences in 3 of 16 measurements between the 2 methods. Alqahtani reported that analysis using CephX® was fast and efficient, and the measurements obtained from both methods are correlated and highly reproducible. Similarly, this study showed statistically significant differences in 4 of 22 measurements in the permanent dentition group and 8 of 22 measurements in the mixed dentition group between the 2 methods (Table 3 and 4).
This study had the limitation of being conducted in a single center. If the study entailed collecting data from multiple institutions, more general conclusions could have been drawn. This study was conducted using a single program for cephalometric analysis in children and adolescents. Subsequent studies on the comparative evaluation of various deep learning programs for cephalometric analysis will be more meaningful. Another limitation was that the subjects of this study were selected without considering the skeletal class. Additional studies are needed for a more accurate evaluation by designing patient-classified studies according to skeletal class I, II, and III. Also, further assessment studies using larger samples will benefit the clinical applications of deep learning techniques in dentistry.
The significance of this study lies in the fact that it is the first study to study the reliability of a deep learning-based orthodontic analysis method in patients with mixed and permanent dentitions. The evaluation of deep learning-based orthodontic analysis, which provides immediately useful data for treatment planning, is meaningful for clinical applications. In the cephalometric radiographs of mixed dentition, there may be errors in tooth-related landmarks and measurements due to the overlapping of deciduous teeth and the permanent tooth germ. When performing the orthodontic analysis of children and adolescents using the deep learning-based program, it is important for dentists to be aware of the above limitations and do not rely entirely on this program. In clinical practice, dentists make individual corrections by re-positioning the landmarks after obtaining the results of orthodontic analysis from WebCeph. In using a deep learning-based analysis program as an auxiliary tool for orthodontic diagnosis of pediatric and adolescent patients, the dentist’s judgment and abundant clinical experience remain important. Understanding the above limitations, using this program appropriately can help pediatric dentists decide whether or not to begin orthodontic treatment.
Ⅴ. Conclusions
Most of the measurements analyzed by the conventional and deep learning-based cephalometric system did not show a significant difference in the permanent dentition group, with the exception of some variables. However, some measurements showing a statistically significant difference between the 2 methods were more in the mixed dentition group. When using deep learning-based programs for orthodontic analysis of pediatric and adolescent patients, it is recommended to recognize the limitations of this program and use it with the proper judgment.