Multilevel Analysis on Spatial Distribution and Socio-Environmental Factors of Dental Caries in Korean Children
Article information

Trans Abstract
This study aims to identify the regional distribution in the prevalence of dental caries and related multidimensional factors among 12-year-old children in Korea. Data from the 2018 Child Oral Health Survey were used to calculate the average DMFT index of 12-year-old children in metropolitan cities, and a multi-level regression model was applied to explain the regional distribution of dental caries prevalence and related factors. Factors were divided into two levels by administrative structure. This study finds a significant regional difference in the prevalence of dental caries in 12-year-old Korean children across metropolitan cities. Multilevel analysis showed that district-level factors (average number of pit and fissure-sealed permanent teeth, dental treatment demand rate, preventive treatment rate, sex ratio, and number of dentists per 100,000 people) and metropolitan-level factors (intakes of cariogenic beverages and number of pediatric dental hospitals and clinics per 100,000 people) had a significant effect on dental caries prevalence (p < 0.05). Individual characteristics and local socio-environmental factors influence the prevalence of dental caries. Especially considering the strong dependence on preventive treatment and accessibility to dental care services, it is necessary to provide adequate preventive treatment and expand health care resources in high-risk areas of dental caries.
Introduction
Dental caries is a disease with epidemiological characteristics that demonstrate a rapid increase in prevalence from early childhood to adolescence, followed by a moderate decline after young adulthood [1]. Caries tend to be more common and concentrated during childhood, especially around the age of 12. This age serves as a benchmark for comparing the prevalence of caries in permanent teeth on an international scale. At this stage, the eruption of permanent teeth is complete, yet the enamel is not fully mineralized, making it highly susceptible to caries.
Dental caries prevalence does not follow a normal distribution within a population. Instead, it tends to exhibit bias, meaning that there are groups of people who are more susceptible or have a higher risk for caries development. In particular, oral diseases have been reported to be more prevalent among socially marginalized groups and often show a social gradient based on socioeconomic status [2]. Indeed, inequalities in oral health according to socioeconomic status have persisted over time [3]. Since the 2000s, research has been conducted to identify the factors contributing to these differences in dental caries prevalence [4]. Notably, economic, psychosocial, and behavioral factors are believed to interact and collectively contribute to the prevalence of dental caries; therefore, their associations should be considered in order to better understand the inequalities observed in dental caries prevalence [5].
Since the 2000s, studies identifying regional differences in disease distribution and revealing spatial inequalities in outbreaks, making full use of geographic information systems (GIS), have emerged [6]. Spatial inequality in disease distribution refers to differences in prevalence caused by differences in locally endogenous factors, such as socioeconomic, physical, and institutional environments [7]. In a multifaceted stream of research that includes socio-environmental factors, international studies have identified regional differences in dental caries prevalence [8-10]. In Korea, studies at the individual or population levels have reported differences in the distribution of caries according to individual behavioral factors or socioeconomic levels, and some studies have confirmed that the prevalence of caries is higher in rural areas than in urban areas [11-13]. However, these studies only identified differences in caries prevalence and did not report spatial analyses of the causes behind these regional differences.
Regional differences in the prevalence of dental caries must be considered in the context of geographic space, as differences in socioenvironmental factors in different regions contribute to individual health inequalities. As regions are hierarchical administrative units, we can apply multilevel models that are known to be suitable for analyzing data with a multilevel structure. Multilevel models are methodologies for minimizing statistical estimation errors in the analysis of data with a hierarchical structure [14] and are particularly effective for analyzing spatial data [6,15]. By using data from two or more hierarchical levels, multilayer models can reduce errors in conceptual and statistical estimations caused by aggregation or individualization. In addition, in spatial analysis, administrative regions are often used as the unit of analysis, which is clearly based on reality; however, the description of the phenomenon to be analyzed depends on the hierarchy of the administrative regions used [16]. Therefore, studies that use only a single spatial unit of data have limitations when interpreting the analysis results. Therefore, it is appropriate to apply a multilayer model that utilizes two or more hierarchical levels when analyzing spatial data.
This study aimed to determine the regional distribution of dental caries among 12-year-old children using data from the 2018 Korean Survey of Children’s Oral Health and to analyze the individual and social factors that cause differences in regional distributions by applying a multilevel model.
Materials and Methods
This study was approved by the Institutional Review Board of Kyungpook National University Dental Hospital (Approval No. KNUDH-2023-08-02-00).
1. Research participants
This study used raw data downloaded from the Korean Survey of Children’s Oral Health, which was conducted by the Ministry of Health and Welfare in 2018. The data were acquired from the Korean Centers for Disease Control and Prevention website [1] according to the procedure for using raw data for analysis. The survey was conducted from April to December 2018, encompassing all children aged 5 and 12 who were living in Korea during that time period.
To ensure budgetary and research efficiency, survey data were published by calculating city-level statistics for metropolitan cities and agglomerated province-level statistics for city areas. Therefore, provincial areas without raw data at the municipal level and the survey data of 5-year-old children were also excluded. As a result, the survey data of 13,484 children aged 12 years for whom raw data were available at the municipal level were used for analysis, with the exclusion of missing values and non-respondents.
2. Research methods
To check the regional distribution of the average DMFT (“Decayed, Missing, and Filled Teeth”) index of 12-year-old children in metropolitan cities, we calculated these values for seven metropolitan cities included in the 2018 Korean Survey of Children’s Oral Health.
To investigate the factors contributing to differences in the distribution of these values, we utilized variables categorized into indicators associated with individual dental utilization, oral health-related behavior, and local socioenvironmental indicators. These variables were sourced from raw data obtained from the 2018 Child Oral Health Survey, data provided by the National Statistical Office of Korea, and open data provided by the Health Insurance Review and Assessment Service. To construct the appropriate variables for this study, we conducted model validation by combining several items from the Child Oral Health Survey. Ultimately, we selected the variables by creating combinations that had a significant impact on the regional distribution of the DMFT index, all while avoiding the issue of multicollinearity. Each variable was further categorized into city-county-district levels and metropolitan city levels according to the structure of the data for multilayer analysis.
For the city-county-district level variables, as indicators of individual dental utilization, we used the average number of pit and fissure-sealed permanent teeth (PFSPT), the rate of demand for dental treatment in the past year, and the rate of preventive treatment received in the past year, including pit and fissure sealant and fluoride application. Additionally, we used demographic variables for the region, specifically the sex ratio of the surveyed population and the number of dentists per 100,000 people, as variables indicating healthcare resource variables.
For the metropolitan city-level variables, the gross regional domestic product (GRDP) per capita was used as a variable to represent the regional economic level. Additionally, the average daily intake of cariogenic beverages was used as an indicator of oral health behavior, based on two daily intakes. Meanwhile, the indicator of local healthcare resources, the number of pediatric dental clinics and hospitals per 100,000 population, was used, and the data included hospitals with pediatric dentistry within the category of university hospitals nationwide and clinics with at least one pediatric dentist as of December 31, 2022.
The descriptions and mean values for each variable are shown in Table 1. The distribution of the DMFT index by administrative region was mapped using ArcGIS Pro (ESRI, Redlands, CA, USA).
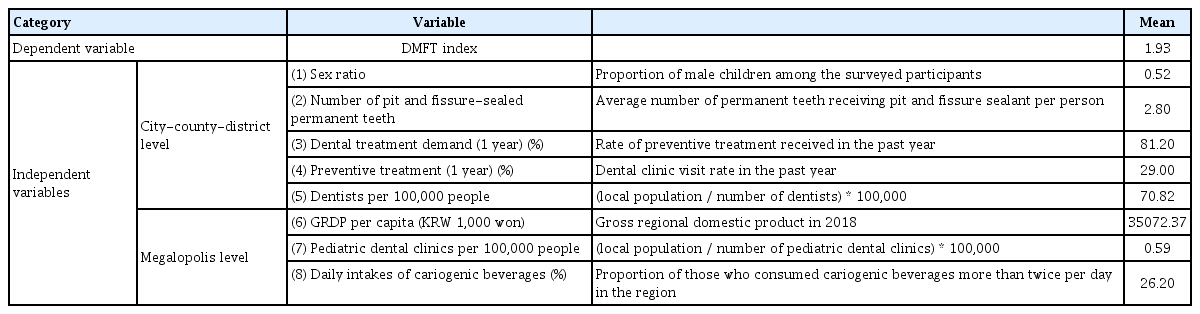
Variables used in this study
3. Statistical methods
Utilizing the DMFT index spatial data structured hierarchically as “metropolitan city” and “city-county-district”, this study aimed to identify the influence of the city-county-district (lower hierarchy) level, the influence of the metropolitan city (higher hierarchy) level, and the reciprocal influence between the metropolitan city and city-county-district levels through multilayer model analysis. Given that hierarchical data often share common regional characteristics (e.g., population), individuals living in the same region may exhibit relatively homogeneous characteristics. This violates the basic assumption of regression analysis, which requires the independence of error terms [17]. In order to solve these statistical errors, a hierarchical linear model was used to perform a multilayer analysis, and the specific analysis process was outlined as described below.
First, we constructed a null model that includes only the metropolitan city and municipal district DMFT indexes without any independent variables. This is to check for differences in dental caries prevalence between regions, and to determine the proportion of variance explained by the municipal and metropolitan levels in the total variance of the DMFT index to verify the explanatory power of hierarchical regional factors. The null hypothesis was used to evaluate the intergroup variance with the total variance of the dependent variable (the DMFT index) and to determine the necessity of employing a multilevel model [13]. Next, we tested the impact of local factors on the prevalence of dental caries by introducing variables at the lower level of the hierarchical administrative division, the city-county-district level, and finally, by introducing independent variables at the higher level, the metropolitan city level.
The statistical analysis program R4.2.3 (R Foundation for Statistical Computing, Vienna, Austria) was used for multilayer model analysis in this study, and the multilayer model was implemented using the nlme package.
Results
1. Regional distribution of dental caries prevalence
The average DMFT index for all metropolitan areas was 1.91 (Table 1). The average DMFT index for each metropolitan city was 2.41, the highest in Gwangju, followed by 2.19 in Busan, 1.97 in Seoul, 1.81 in Daegu, 1.64 in Incheon, and 1.43 in Ulsan, while Daejeon had the lowest caries incidence at 1.40. Fig. 1 is a caries map showing the distribution of the average DMFT index of metropolitan areas, where the numbers on the map represent the administrative regions (counties, districts) of each city. The map shows that Gwangju Metropolitan City has an overall high caries incidence rate, while Daejeon Metropolitan City, Ulsan Metropolitan City, and Incheon Metropolitan City have an overall low caries incidence rate. Within each metropolitan area, the highest caries rates were 3.07 in Guro-gu, Seoul; 2.84 in Nam-gu, Gwangju; 2.10 in Buk-gu, Daegu; 1.78 in Daedeok-gu, Daejeon; 2.55 in Buk-gu, Busan; 1.92 in Dong-gu, Ulsan; and 2.01 in Gyeyang-gu and Ongjin-gun, Incheon. The overall caries prevalence was low in Ulsan, Daejeon, and Incheon.

Geographic distribution of the Decayed, Missing, and Filled Teeth index.
The numbers on the map represent the administrative district (county or ward) of each city, and the names of the districts are listed below. Seoul: 1. Jongno-gu, 2. Jung-gu, 3. Yongsan-gu, 4. Seongbuk-gu, 5. Gwanjin-gu, 6. Dongdaemun-gu, 7. Jungnang-gu, 8. Seongdong-gu, 9. Gangbuk-gu, 10. Dobong-gu, 11. Nowon-gu, 12. Eunpyeong-gu, 13. Seodaemun-gu, 14. Mapo-gu, 15. Yangcheon-gu, 16. Gangseo-gu, 17. Guro-gu, 18. Geumcheon-gu, 19. Yeongdeungpo-gu, 20. Dongjak-gu, 21. Gwanak-gu, 22. Seocho-gu, 23. Gangnam-gu, 24. Songpa-gu, 25. Gangdong-gu. Busan: 1. Jung-gu, 2. Seo-gu, 3. Dong-gu, 4. Yeongdo-gu, 5. Busanjin-gu, 6. Dongnae-gu, 7. Nam-gu, 8. Buk-gu, 9. Haeundae-gu, 10. Saha-gu, 11. Gunjung-gu, 12. Gangseo-gu, 13. Yeonje-gu, 14. Suyeong-gu, 15. Sasang-gu, 16. Gijang-gun. Ulsan: 1. Jung-gu, 2. Nam-gu, 3. Dong-gu, 4. Buk-gu, 5. Ulju-gun. Daegu: 1. Jung-gu, 2. Dong-gu, 3. Seo-gu, 4. Nam-gu, 5. Buk-gu, 6. Soseong-gu, 7. Dalseo-gu, 8. Dalseong-gun. Incheon: 1. Dong-gu, 2. Yeonsu-gu, 3. Namdong-gu, 4. Bupyeong-gu, 5. Gyeyang-gu, 6. Seo-gu, 7. Michuhol-gu, 8. Ganghwa-gun, 9. Ongjin-gun, 10. Jung-gu. Daejeon: 1. Dong-gu, 2. Jung-gu, 3. Seo-gu, 4. Yuseong-gu, 5. Daedeok-gu. Gwangju: 1. Jung-gu, 2. Dong-gu, 3. Seo-gu, 4. Nam-gu, 5. Buk-gu.
2. Regional distribution of factors influencing the development of dental caries
The average number of PFSPT across metropolitan cities was 2.8. By administrative region, Ulsan Metropolitan City had the highest value of 4.09, followed by Daegu Metropolitan City at 3.43, Gwangju Metropolitan City at 2.93, Seoul Metropolitan City at 2.58, Incheon Metropolitan City at 2.40, and Busan Metropolitan City at 2.39, and Daejeon Metropolitan City at 1.79, the lowest. At the citycounty-district level, the highest values were 4.82 in Dobong-gu, Seoul; 3.15 in Jung-gu, Busan; 4.61 in Dalseong-gun, Daegu; 3.35 in Seo-gu, Incheon; 3.68 in Seo-gu, Gwangju; 1.94 in Jung-gu, Daejeon; and 5.67 in Buk-gu, Ulsan. In contrast, these values were the lowest at 1.62 in Guro-gu, Seoul; 1.69 in Saha-gu, Busan; 2.61 in Seo-gu, Daegu; 1.48 in Woongjin-gun, Incheon; 2.15 in Nam-gu, Gwangju; 1.48 in Seo-gu, Daejeon; and 3.4 in Jung-gu, Ulsan within each metropolitan city (Table 2-1, 2-2).
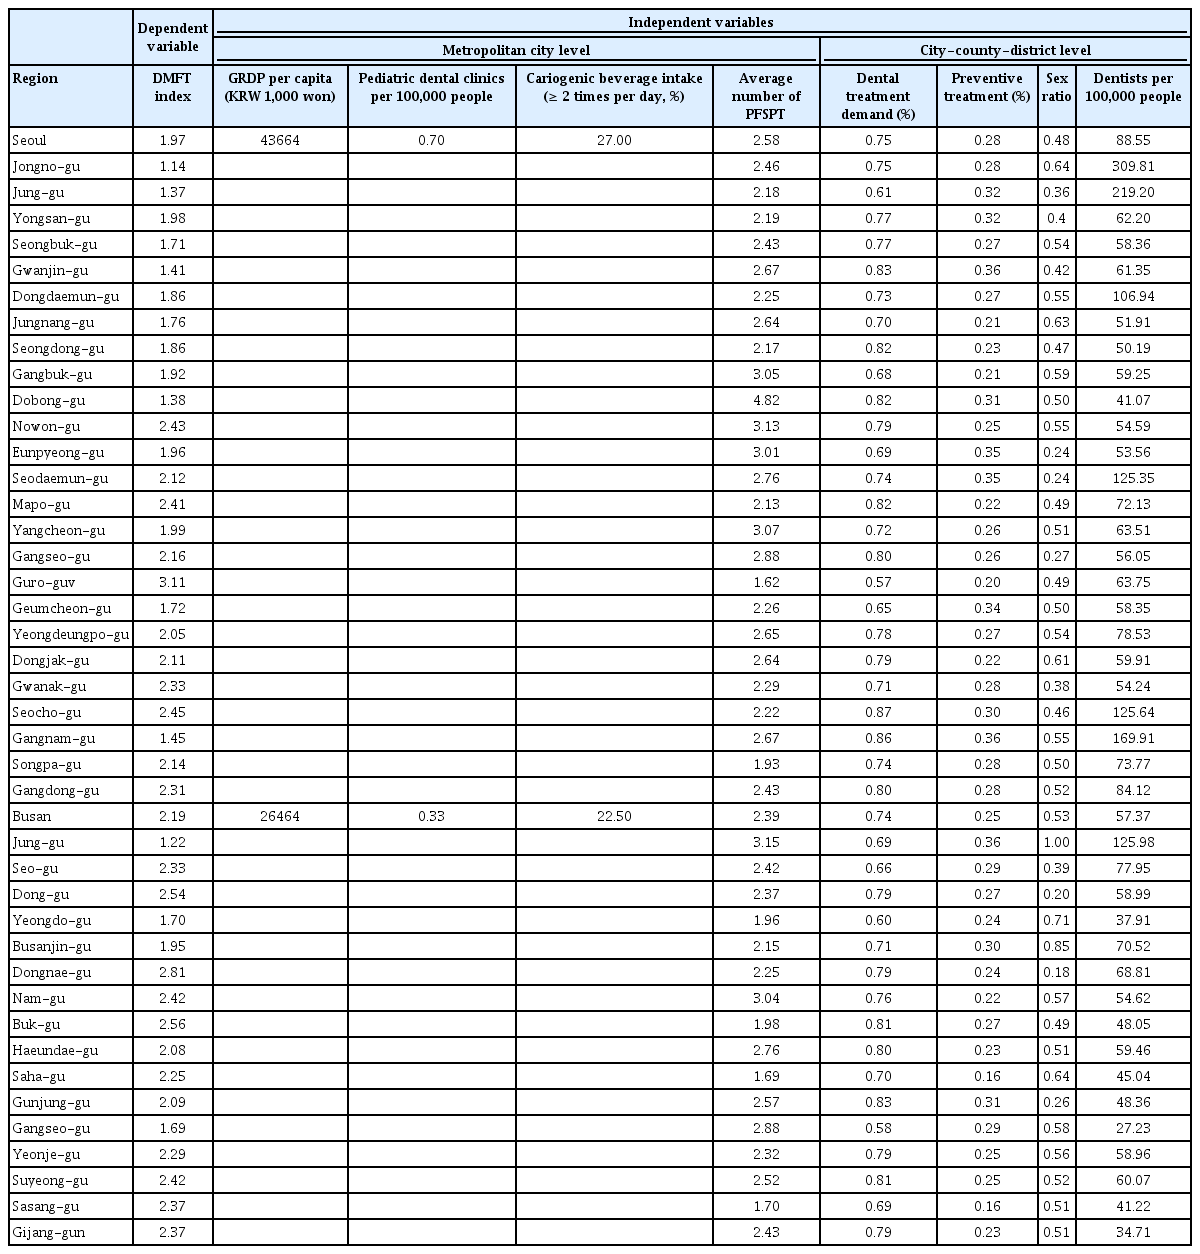
Regional distribution of variables used in the study

Regional distribution of variables
The average rate of demand for dental treatments in the past year was 71% across all metropolitan cities. By metropolitan cities, Ulsan Metropolitan City had the highest rate at 81%, followed by Gwangju Metropolitan City at 76%, Seoul Metropolitan City at 75%, Busan Metropolitan City at 74%, Incheon Metropolitan City at 67%, and Daejeon Metropolitan City at 64%, while Daegu Metropolitan City had the lowest rate at 60%. By district, 87% of participants in Seocho-gu, Seoul; 83% in Geumjeong-gu, Busan; 70% in Suseong-gu, Daegu; 78% in Dong-gu, Incheon; 84% in Gwangsan-gu, Gwangju; 75% in Yuseong-gu, Daejeon; and 83% in Jung-gu, Ulsan had the highest rate of demand for dental treatments. In contrast, at 57% in Guro-gu, Seoul; 58% in Gangseo-gu, Busan; 51% in Seo-gu, Daegu; 60% in Ganghwa-gun, Incheon; 71% in Buk-gu, Gwangju; 58% in Daedeok-gu, Daejeon; and 80% in Buk-gu, Ulsan, these regions exhibited low rates of dental treatment demand in the past year (Table 2-1, 2-2).
The average rate of preventive treatment received in the past year was 29% across all metropolitan cities, with Daegu Metropolitan City having the highest rate at 32%, followed by Gwangju Metropolitan City at 31%, Incheon Metropolitan City at 29%, Seoul, Daejeon Metropolitan City, and Ulsan Metropolitan City at 28%, and Busan Metropolitan City at 25%. By district, the highest preventive treatment rate was 47.27% in Dalseong-gun, Daegu Metropolitan City, and the lowest was 15.54% in Saha-gu, Busan Metropolitan City (Table 2-1, 2-2).
Among the variables representing the accessibility of medical services, the number of dentists per 100,000 people was highest in Seoul at 88.54, followed by Daegu at 86.57, Gwangju at 86.55, Busan at 57.37, Daejeon at 56.19, and Incheon at 47.73, and lowest in Ulsan at 40.44. Jongno-gu, Seoul, had the highest number of dentists (309.81), whereas Ulju-gun, Ulsan, had the lowest number of dentists (25.73) (Table 2-1, 2-2).
Daejeon Metropolitan City had the highest sex ratio at 0.60, followed by Daegu Metropolitan City at 0.55, Incheon Metropolitan City and Busan Metropolitan City at 0.53, Gwangju Metropolitan City at 0.51, and Ulsan Metropolitan City at 0.5, while Seoul Metropolitan City had the lowest male-to-female ratio at 0.48. (Table 2-1, 2-2).
Among the metropolitan city-level variables, the GRDP per capita was highest in Ulsan Metropolitan City (KRW 63,793), followed by Seoul Metropolitan City (KRW 43,664), Incheon Metropolitan City (KRW 30,194), Daejeon Metropolitan City (KRW 27,214), Gwangju Metropolitan City (KRW 26,654), and Busan Metropolitan City (KRW 26,464), and lowest in Daegu Metropolitan City (KRW 23,151) (Table 2-1, 2-2).
The number of pediatric dental hospitals and clinics per 100,000 people was highest in Gwangju Metropolitan City at 0.90, followed by Daejeon Metropolitan City at 0.82, Ulsan Metropolitan City at 0.72, Seoul Metropolitan City at 0.7, and Incheon Metropolitan City at 0.61, while Busan Metropolitan City at 0.33 and Daegu Metropolitan City at 0.34 were the two regions found to have a low density of pediatric dental hospitals and clinics, indicating low geographic accessibility to pediatric dental care (Table 2-1, 2-2).
Finally, regarding the intake of cariogenic beverages at least twice per day, the rate was high in Gwangju Metropolitan City (35.4%), followed by Daejeon 28.7%, Seoul 27%, Daegu 25.6%, Incheon 25.4%, Ulsan 24.7%, and Busan 22.5% (Table 2-1, 2-2).
3. Modeling analysis results
Table 3 presents the results of the multilevel analyses. Before conducting a multilevel analysis, it was necessary to ensure that the differences in the variables between the groups were significant [18]. As a result of analyzing the null model, it can be concluded that the application of the multilevel model in this study was appropriate. The results of the analysis are mainly divided into fixed effects, which represent differences in the characteristics of the variables, and random effects, which represent differences in the characteristics of the groups, and the explanatory power of the differences between the groups can be checked by the random effects. Interclass Correlation Coefficient (ICC) means how much of the total variance is explained by the level of the random effect, and in this study, it means the proportion of the variance of DMFT at the metropolitan level. ICC values range from 0 to 1 and values exceeding 0.05 signify the suitability of employing multilayer analysis [15]. The ICC value in this study was 0.132, indicating that the metropolitan city level explains approximately 13.2% of the total variance in the DMFT index at the city-county-district level, exceeding the 5% threshold, thereby confirming significant differences among the groups. Thus, the application of the multilevel model was considered appropriate.
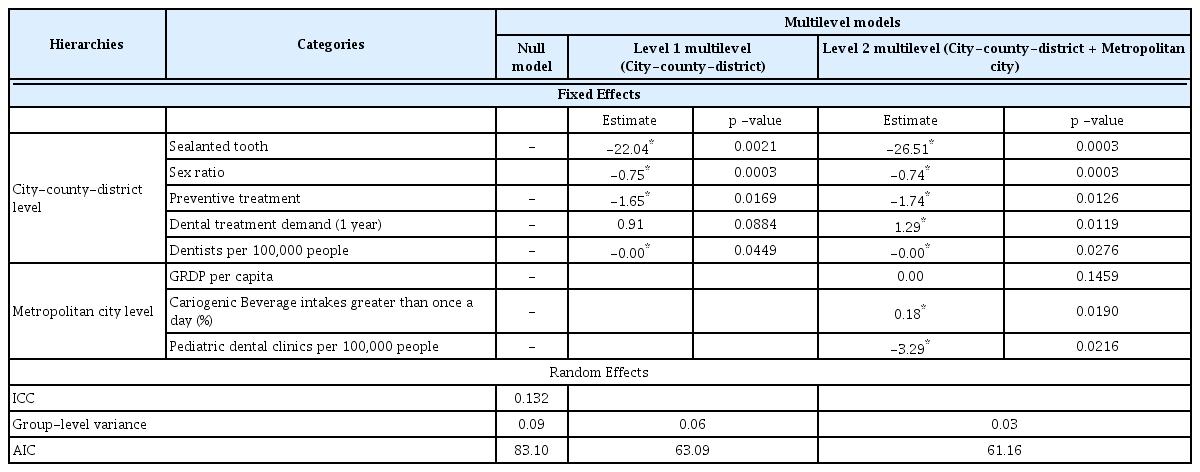
Estimation results of multilevel models by hierarchies and categories
In the first-level model analysis using only city-county-district-level data as variables, the variance decreased from 0.09 to 0.06 compared to the null model. Additionally, the Akaike Information Criterion (AIC) value, which indicates the fitness of the model, decreased in the onelevel model compared to the null model, indicating a much more appropriate result for the first-level model. Among the variables affecting the incidence of caries, the following variables were significant (p < 0.05): average number of PFSPT, rate of preventive treatment received in the past year, sex ratio, and number of dentists per 100,000 population.
In the second-level model with the metropolitan city-level variable, the variance of the metropolitan city-level intercept decreased from 0.06 to 0.03 compared with that in the first-level model. Additionally, the AIC value decreased, indicating that the inclusion of the metropolitan city variable improved the explanatory power of dental caries prevalence. This also indicates that the second-level model yielded a more robust result than the firstlevel model for analyzing the DMFT index by region. In addition to the four variables that were significant in the first-level model, the rate of dental treatment demand in the past year also emerged as significant (p = 0.0119). Two metropolitan city-level variables, the number of pediatric dental hospitals and clinics per 100,000 people and the rates of cariogenic beverage intakes greater than twice a day, exhibited a significant relationship (p < 0.05), whereas GRDP per capita had no significance (p = 0.1459).
Several significant findings emerged from the analysis. The average number of PFSPT and sex ratio of the surveyed population were the most significant (p = 0.0003) and negatively correlated, indicating that regions with a greater number of PFSPT and a higher proportion of boys had a lower caries prevalence. The rate of preventive treatment received in the past year (p = 0.0126), the rate of dental treatment demand in the past year (p = 0.0119), and the intake of cariogenic beverages at least twice a day (p = 0.0190) exhibited significance. These results indicated that regions with higher rates of preventive treatment in the past year had a lower DMFT index, whereas those with higher rates of dental treatment demand in the past year and children consuming cariogenic beverages at least twice a day had a higher DMFT index. Finally, the number of dentists, and pediatric dental hospitals and clinics per 100,000 people displayed significance (p = 0.0216), indicating that areas with more dentists and pediatric dental clinics had lower caries prevalence.
Discussion
This study was conducted using data from the 2018 Korean Survey of Children’s Oral Health to determine the regional distribution of dental caries among 12-year-old children and identify social factors that influence the prevalence of dental caries along with individual oral health-related behaviors. As the survey was conducted by well-trained investigators and used a nationally representative sample, the raw data used in this study and the results can be considered generalizable [1]. In addition, the study selected survey data from 2018 to utilize data before the COVID-19 pandemic, which could have caused significant changes in children’s behaviors and local environments, and to include the impact of sealant reimbursement expansion policies since 2017.
In this study, we first calculated the average DMFT index for each metropolitan city to determine the regional distribution of dental caries. Because these spatial data are based on hierarchical administrative divisions, lower-level data cannot be independent of the influence of higher-level areas; thus, spatial analysis using multilayer models is necessary. For this reason, this study examined the interaction effect of hierarchical regional-level variables on the prevalence of dental caries in children through multilevel model analysis. The results showed that the distribution of dental caries prevalence varied by region. The results of the baseline model showed that the regional random effects were significant, and the ICC value, representing the proportion of variance attributed to the variance at the metropolitan city level in relation to the DMFT index, was found to be 13.2%. This explains the variation in caries prevalence by region of residence, suggesting that certain characteristics associated with a child’s residence may affect the prevalence of caries. Considering that an ICC value of 15% indicates a strong regional effect [18], the multilevel analytical approach used in this study can be considered valid.
In this study, a multilevel analysis of the socio-environmental determinants of dental caries in 12-year-old children revealed that in the first-level model, which included only city-county-district-level variables, the significant variables were the average number of PFSPT, the rate of preventive treatment in the past year, the sex ratio, and the number of dentists per 100,000 population. In the second-level model, which additionally included metropolitan city-level variables, the rate of dental treatment demand in the past year, the rate of cariogenic beverage intakes at least twice per day, and the number of pediatric dental hospitals and clinics per 100,000 people were also observed to be significant.
The average number of PFSPT (p = 0.0003) and preventive treatments in the past year (p = 0.0126) were highly significant in both the first- and second-level models, indicating a high dependence on preventive dental care for the development of dental caries. With a DMFT index of 3.07, Guro-gu, which had the highest prevalence of dental caries in Seoul, had the lowest average number of PFSPT (1.62) and the lowest preventive treatment rate (20%). In contrast, Gangnam-gu, stands out with a notably low DMFT index of 1.45, demonstrating the lowest prevalence of dental caries, with an average of 2.67 PFSPT and the highest preventive treatment rate of 36%. These findings align with prior research by Kim et al. [11] which utilized data from the 2010 National Oral Health Survey, and Kim et al. [12], which utilized data from the 2015 Korean Survey of Children’s Oral Health. Both studies showed a high association between the prevalence of dental caries in 12-year-old children and their utilization of preventive treatments, which, in turn, influences their likelihood of falling into the high-risk group for dental caries. Therefore, active recommendations are needed for areas with low implementation rates of preventive treatments, including the application of pit and fissure sealants and fluoride, in order to prevent dental caries.
In Korea, access to pit and fissure sealants has improved significantly since their inclusion in the National Health Insurance Program in 2009, expanding coverage to the first and second molars in individuals under the age of 18 and reducing the co-payment to 10%. However, despite the expansion in coverage, regional disparities in access within urban and rural areas have been noted [19]. In this study, we found definite variations in the dental sealant coverage rates in metropolitan cities. Although the policy of subsidizing pit and fissure sealants has ensured economic accessibility to dental care, we believe that the regional disparities that still exist can be mitigated by increasing the geographic accessibility of dental services to areas with high dental care needs. This improved geographic accessibility to pediatric dental clinics can be expected to help reduce the difference in pit and fissure sealant utilization, especially given the age at which the sealant is applied.
The sex ratio of the surveyed population (p = 0.0003) was found to be a significant negative factor affecting the prevalence of dental caries, indicating that a lower sex ratio (i.e., a higher percentage of girls) is associated with a higher prevalence of dental caries. This trend was consistent across most areas, with exceptions in Gwangju Metropolitan City and Ulsan Metropolitan City. Specifically, areas with the lowest distribution of the DMFT index, such as Jongno-gu, Seoul, Jung-gu, Busan, Suseong-gu, Daegu had the highest proportion of males within their respective cities. This supports the findings of Kim et al. [12] and Jung et al. [13], who demonstrated that girls are at a higher risk of caries than boys. This may be due to the earlier eruption of first molars in girls and their higher intake and frequency of sugar consumption in comparison to boys [20]. In particular, the period immediately after an eruption requires more attention and care in girls because the enamel is not fully hardened and matured, making it relatively more susceptible to acid decalcification and increasing the risk of caries [21]. Given these findings, it is crucial to proactively implement preventive treatments, such as fissure sealants and fluoride applications, immediately after the eruption of permanent teeth.
Dental treatment demand in the past year was significant in the second-level model analysis (p = 0.0119), indicating a risk factor for dental caries prevalence. Previous studies using data from the 2010 National Oral Health Survey and the 2015 Children’s Oral Health Survey also found that children who visited a dentist in the past year were 1.34 times and 2.13 times more likely to be included in the dental caries high-risk group, respectively [11,12]. According to the Ministry of Health and Welfare’s Oral Health Survey, the prevalence rate of dental caries in the permanent teeth of 12-year-old children decreased from 42.0% in 2000 to 6.9% in 2018 [12]. This decrease in the permanent caries index can be interpreted as a result of children with caries receiving appropriate dental care. In this study, the dental visit rate was only significant in the two-level model with the metropolitan area variable, suggesting that further analysis of the mediation effect is needed to estimate the impact of the variable more accurately.
The number of dentists per 100,000 population (p = 0.0276) and pediatric dental clinics per 100,000 population (p = 0.0216), variables reflecting local access to healthcare, were significantly associated with negative regression coefficients, indicating that the fewer healthcare resources and lower access to healthcare, the higher the prevalence of dental caries. The number of dentists per 100,000 people in each metropolitan area was the highest in Seoul at 88.54 and the lowest in Ulsan at 40.44, with the difference between the regions being more than double. By county, several regions such as Jung-gu, Seoul (309.81), Busan (125.98), and Daegu (369.08), stood out as having a high distribution of dentists, which correspond to the central business districts of each city, indicating a high distribution of dentists in central city areas with a large number of floating people.
At the metropolitan city level, the number of pediatric dental clinics per 100,000 population was used to represent accessibility to healthcare resources. This variable was calculated based on the total population of the region, not the number of children under 18, as the proportion of the pediatric population per metropolitan area tends to be similar to the proportion of the total population. As of December 31, 2022, the number of pediatric dental clinics nationwide was 316, and the number of pediatric dentists working in pediatric dental clinics was 395. The result showed that the highest was in Gwangju Metropolitan City (0.90), whereas the lowest was in Busan Metropolitan City (0.33) (Table 2-1, 2-2). Additionally, Seoul, Incheon, Daejeon, and Ulsan metropolitan cities, which have an above-average distribution of pediatric dental clinics, had a below-average caries prevalence rate. The distribution of pediatric dental clinics is different from the distribution of general dentists discussed earlier, showing similarities to the distribution of the youth population within each metropolitan city, such as Songpa-gu, Seoul, Haeundae-gu, Busan, and Dalseo-gu, Daegu, rather than the central city.
Access to healthcare for pediatric patients is crucial owing to their shorter visit intervals compared to adults, which is influenced by factors such as rapid caries progression, tooth exchange, and growth [22]. Healthcare access encompasses an individual’s ability to pay for healthcare and the availability of healthcare personnel and facilities. One of the key indicators of the availability of healthcare resources is the distribution of healthcare resources, where the number of healthcare personnel and healthcare facilities in an area determines the ease of physical access [23]. In 2010, the number of dentists per 1,000 people in Korea was 0.43, which was lower than the average of 0.62 in the OECD countries during the same period. The phenomenon of an imbalance in the supply and demand of dentists between regions has gradually worsened and has become a social phenomenon [24]. In addition, a study on the accessibility of pediatric specialty dental clinics by Lee and Ra [22] revealed significant differences in the density of pediatric dental clinics and service area between large cities such as Seoul, Gyeonggi, Busan, and Gwangju, and small cities such as Gyeongbuk and Jeollabuk-do, indicating that there are many underserved areas in small cities. These differences in the distribution of dental resources can be major barriers to dental healthcare utilization. In this study, we identified differences in the distribution of dentists and pediatric specialty dentists at the district level in metropolitan areas by disaggregating administrative regions, demonstrating that these differences in healthcare quality may affect the prevalence of dental caries. Therefore, future policies on public healthcare services or the locations of pediatric specialty dentistry services should reflect these results to address the problem of regional healthcare resource imbalances.
This study found that the GRDP per capita, a variable that reflects the economic level of a region, had no significant effect on the prevalence of dental caries (p = 0.1459). This is in line with previous studies showing that dental caries in general are influenced by socioeconomic factors and are modulated by the availability of social resources [1,25,26]. Several international studies have confirmed inequalities in dental caries prevalence among children based on socioeconomic status [27-29], a result that deviates from our expectations. However, recent studies have reported contradictory results. The study on dental caries disparities by household income level by Jung [30] analyzed data spanning the 4th through 7th National Health and Nutrition Examination Surveys and found no significant difference in dental caries prevalence across household income levels, and no clear disparities could be discerned. The results of our study reported that there is no difference in the prevalence of dental caries based on income levels by region, as well as that the economic status of the metropolitan level of the region does not affect the prevalence of dental caries in the county level of the region. The decrease in regional differences in the prevalence of dental caries due to economic disparities is attributed to Korea’s overall economic growth, which has reduced the impact of income disparities between regions, and the expansion of medical coverage through the state-led medical insurance system, which was gradually expanded. In particular, the policy of expanding coverage of reimbursement for fissure sealant and light-curable composite resin restorations is likely to increase conservative and proactive treatment interventions in the early stages of caries, thereby further contributing to the reduction of oral health inequalities based on economic disparities.
In terms of individual oral health-related behavioral factors, since the mid-2010s, the daily sugar intake of Korean children and adolescents has been approximately 60g [31], which is more than double the 5% (25g) of the recommended daily energy intake associated with dental caries risk [32]. With an inverse trend of higher intakes at higher income levels, it is possible that individual behaviors, such as sugar intake rates, may be confounding factors in the failure to identify differences in dental caries prevalence based on economic disparity [5]. However, the results of this study are limited by the fact that it focused solely on the included metropolitan areas and did not include data from smaller cities or towns at lower administrative levels in the provinces. Therefore, future research should conduct more comprehensive analyses that consider lower-level economic indicators and individual household income levels to provide a more detailed understanding of these dynamics.
As an oral health behavioral variable, the consumption of two or more cariogenic beverages per day was significantly associated with the prevalence of dental caries (p = 0.0190) at the metropolitan city level, indicating that the prevalence increased in areas with higher rates of cariogenic beverage consumption. By region, the prevalence of dental caries was the highest in Gwangju, which had the highest rate of cariogenic beverage consumption (35.4%), whereas Ulsan (24.7%) and Incheon (25.4%), which had relatively low rates of consumption of cariogenic beverages, had lower rates of dental caries than the metropolitan average. These findings align with those in a study by Kim et al. [12], which found that children who consumed cariogenic foods twice a day were 1.1 times more likely to be at high risk for dental caries. They also corroborate the findings from a 2010 study by Kim et al. [11], which reported that the likelihood of being included in the high-risk group for dental caries increased as the average number of snacks consumed per day increased. In general, in terms of diet, the nature and frequency of sugar-containing foods affect the occurrence of dental caries [33], as increased snacking frequency can disrupt the balance between demineralization and remineralization, potentially leaving insufficient time for the restoration of the acidic environment to its normal state [34]. Therefore, for the management of individuals at high risk of caries, it is necessary to limit the consumption of sugary snacks, and as a dietary intervention to prevent dental caries, it is recommended to increase the intake of foods with a low sugar content, and protective foods rich in calcium and protein, and nutritional education should be conducted to provide a variety and balance of choices for snacks [35].
Although this study used a representative sample from a nationally representative survey, it is subject to the limitations of cross-sectional studies. Although the risk factors for dental caries can be estimated, the crosssectional nature of the study limits its ability to establish a causal relationship between risk factors and dental caries. In addition, because the survey was conducted at the city-county-district level, data at lower administrative levels (township and village) and individual levels were not available. Consequently, this study focused on specific metropolitan areas, which limited the ability to employ a more sophisticated multilayer model more effectively.
Despite the above limitations, this study analyzed the socioenvironmental determinants of dental caries using a spatial statistical model and is significant owing to its examination of the prevalence of dental caries from a regional perspective. Regional differences in disease distribution were identified, and the distribution of dentists and pediatric dental clinics was found to have a significant effect on the prevalence of dental caries. This study also differs from previous studies in that it sought to analyze the impact of local healthcare resource accessibility and distribution by using the variables number of dentists and number of pediatric dental clinics to analyze related factors in dental caries prevalence. This suggests the need for policy approaches to improve dental access and healthcare delivery systems by strengthening public services in areas with lower geographic accessibility to healthcare services. Because this study analyzed the results of a nationwide survey of children’s oral health, it is representative of the caries status of 12-year-old children in Korea and can be used as a basis for planning policies and projects to promote children’s oral health.
Conclusion
This study multi-dimensionally examined regional differences in the prevalence of dental caries in 12-year-old children and the multiple causative factors and identified several significant individual and socio-environmental factors. In particular, multilevel model analysis was used to analyze hierarchical spatial data, which increased the explanatory power of the results and minimized the statistical estimation error of spatial data by considering the correlation at the regional level.
The prevalence of dental caries increased with higher dental treatment demand and consumption of cariogenic beverages, while a higher proportion of boys, the rate of sealanted teeth and preventive treatment, and the distribution of dentists and pediatric dental clinics decreased the risk of dental caries development. The strong dependence on preventive treatments such as sealants and the availability and accessibility of healthcare resources suggest that appropriate preventive measures and the expansion of healthcare resources are needed in areas at high risk for caries. The results of this study can be used as a basis for planning future projects and policies to promote oral health in children.
Notes
Conflict of Interest
The authors have no potential conflicts of interest to disclose.