


Introduction
Assessing the skeletal maturity and remaining growth potential of a patient is crucial for planning orthodontic treatment and providing effective care. This is especially important for children and adolescents because adjusting their remaining growth can improve their facial profiles and affect treatment methods such as the types and duration of devices and the need for extractions[1-3].
Various indicators have been studied to evaluate growth and development, including chronological age, physical growth, dental maturity, sexual maturity, and skeletal maturity. However, due to individual variability, chronological age, physical growth, sexual maturity, and dental maturity are not suitable predictive tools for accurately assessing the peak growth spurt during puberty[4-6].
Owing to the limitations of other methods, the analysis of skeletal maturity using hand-wrist radiographs is mainly used to predict the peak growth spurt during puberty[7]. There are several methods for evaluating skeletal maturity using hand-wrist radiographs; however, the 11 - stages skeletal maturity indicator (SMI)[8] and the middle phalanx of the third finger (MP3) 5 stages[9] are widely used because of their relative simplicity.
Meanwhile, biochemical markers related to growth regulation, such as growth hormone (GH), insulin-like growth factor-1 (IGF-1), and insulin-like growth factor binding protein (IGFBP-3), are being actively studied for their diagnostic utility in predicting bone maturity.
GH stimulates the production of IGF-1 in the liver, which promotes bone growth, and increased GH levels play an important role in the growth rate during puberty[10,11]. Since GH is secreted pulsatilely by the pituitary gland, a single measurement of GH level is not meaningful[12,13].
Serum IGF-1 and IGFBP-3 levels are good diagnostic indicators for determining GH status. Unlike GH, their levels remain stable throughout the day and have a longer half-life than GH. Serum IGF-1, which is produced in response to GH, is not secreted in significant amounts at birth, but gradually increases as humans grow. IGF-1 accelerates the growth, differentiation, and synthesis of the extracellular matrix in osteoblasts and chondrocytes[14,15].
Circulating serum IGF-1 binds to IGFBP-3, which is directly associated with cell membrane molecules, and plays an important role in regulating bone cell differentiation. IGFBP-3 levels are regulated by GH and can serve as additional indicators of GH secretion[16,17].
To date, several studies comparing IGF-1 levels with lateral cephalograms or hand-wrist radiographs have been reported, but the sample sizes were small and the studies were conducted in different ethnic groups[18-20]. To date, no studies have been conducted on serum IGF1 and IGFBP-3 with radiographic skeletal maturity in Korean children and adolescents. In particular, studies evaluating serum IGFBP-3 levels with skeletal maturity are limited[21] and there have been no comparative studies on the correlation between serum IGF-1 and IGFBP-3 levels and SMI and MP3 stages, to our knowledge.
The purpose of this study was to investigate the correlation between serum IGF-1, IGFBP-3, and hand-wrist radiographs using SMI and MP3 stages in the skeletal maturity assessment of children and adolescents and to evaluate the diagnostic usefulness of serum IGF-1 and IGFBP-3.
Materials and Methods
This retrospective study was approved by the Institutional Review Board of Ajou University Hospital (IRB File No.: AJOUIRB-DB-2023-011) prior to the research.
1. Study subjects
This study included the patients (n = 744), aged 7 to 17, who visited both the Dentistry and Pediatrics departments of Ajou University Hospital from January 2018 to December 2022. Patients with medical problems were initially excluded. Also, patients with incomplete blood test results and those with poor quality of radiographs were excluded. Finally, 205 patients were included in this study (Fig. 1).
2. Study Design
PatientsŌĆÖ sex, age, and medical history were investigated using their medical records. Radiographs of the hand and wrist were taken with a Shimadzu BR-120T (Shimadzu Corporation, Kyoto, Japan) using the following conditions: 42 kVP, 3 mA, scan time, 0.05 sec for patients under 10 years of age and 45 kVP, 3 mA, scan time, 0.05 sec for patients aged 10 years or older; the left hand was imaged. Images were interpreted using the Infinitt PACS (Infinitt Co., Seoul, Korea).
1) Assessment of the Hand-Wrist Bone
Two dentists independently evaluated all hand-wrist radiographs using the SMI stages proposed by Fishman[8] with an interval of two weeks between each interpretation. Based on the relative mandibular growth rate[8], the 11 stages of the SMI were divided into five groups. SMI stages 1 - 3 were categorized as Group I prepuberty, stages 4 - 5 as Group II acceleration, stages 6 - 8 as Group III peak height velocity, stages 9 - 10 as Group IV deceleration, and stage 11 as Group V post-puberty.
2) Assessment of the middle phalanx of the third finger
Two dentists independently evaluated all hand-wrist radiographs to assess the maturation stage of the MP3 using the MP3 5 stages (F, FG, G, H, and I) proposed by H├żgg and Taranger[9] with an interval of two weeks between each interpretation.
3) Serum IGF-1 and IGFBP-3 Blood Tests
Blood samples were collected to measure the serum IGF-1 and IGFBP-3 levels on the day that hand-wrist radiographs were taken. The serum samples were separated by centrifugation and stored at 2 - 8┬░C until testing. Serum IGF-1 and IGFBP-3 concentrations were measured using an immunoradiometric assay kit (Beckman Coulter, Brea, CA, USA).
3. Statistical Analysis
Statistical significance was assessed using SPSS 28 (IBM SPSS Inc., Armonk, NY, USA) with a significance level of p < 0.05. The CohenŌĆÖs kappa coefficients were calculated for the evaluation of the intra- and inter-examiner reliability. The Mann-Whitney U test was used to compare chronological age according to sex. The Kolmogorov-Smirnov test was used to assess normality, and one-way analysis of variance (ANOVA) was performed to compare serum IGF-1 and IGFBP-3 levels between the SMI and MP3 stages. Post hoc analysis was conducted using the Bonferroni correction. The Jonckheere-Terpstra test was used to analyze the tendency of the mean level of serum IGF-1 and IGFBP-3 according to SMI and MP3 stages. To investigate the correlation between the SMI and MP3 stages and variables, Pearson correlation coefficients, Spearman correlation, and point-biserial correlation were calculated, and Stepwise multiple regression analysis was conducted.
Results
The CohenŌĆÖs kappa coefficients for intra-examiner reliability regarding SMI and MP3 stages consistently showed values greater than 0.90. And to evaluate the agreement between the investigators for the SMI and MP3 stages, CohenŌĆÖs kappa coefficients were calculated and found to be 0.825 and 0.848, respectively.
1. Chronological Age Distribution According to SMI and MP3 stages
Tables 1 and 2 show the distribution of chronological age according to sex in the SMI and MP3 stages. In SMI groups, males showed a significantly higher chronological age than females at the same stages, except at stage 11. In MP3 stages, significant differences in chronological age between males and females were observed in stages F, FG, and H.
2. Mean Serum IGF-1 and IGFBP-3 Levels Compared Between Each SMI Group
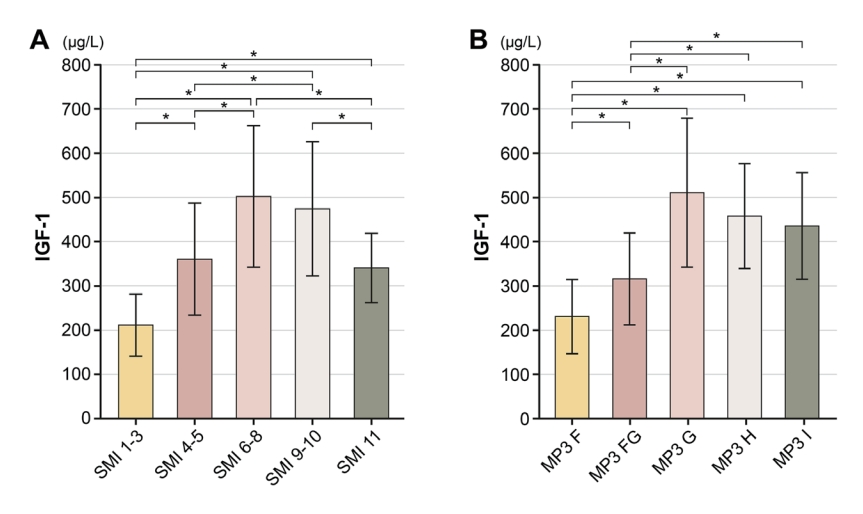
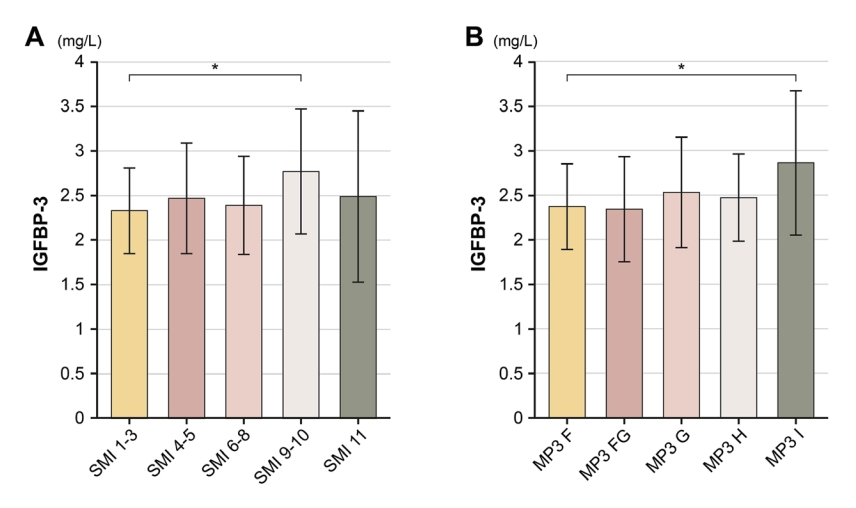
The mean serum IGF-1 level was highest in the SMI 6 - 8 group at 502.24 ┬▒ 160.17 ┬Ąg/L and lowest in the SMI 1 - 3 group at 211.17 ┬▒ 70.08 ┬Ąg/L (p < 0.0001). The mean serum IGFBP-3 level was highest in the SMI 9 - 10 group at 2.77 ┬▒ 0.70 mg/L and lowest in the SMI 1 - 3 group at 2.33 ┬▒ 0.48 mg/L (p=0.010, Table 3).
Post hoc analysis revealed significant differences in serum IGF-1 levels between all groups, except for the pairs of SMI 4 - 5 and SMI 11 stages (p=0.984), and SMI 6 - 8 and SMI 9 - 10 stages (p=0.863, Fig. 2). In contrast, there was a significant difference in mean serum IGFBP-3 levels only between the SMI 1 - 3 and SMI 9 - 10 stages (p=0.003, Fig. 3).
3. Mean Serum IGF-1 and IGFBP-3 Levels Compared Between Each MP3 Stage
The serum IGF-1 level was highest in stage G at 510.63 ┬▒ 168.37 ┬Ąg/L and lowest in stage F at 230.51 ┬▒ 83.80 ┬Ąg/L (p < 0.0001). The serum IGFBP-3 level was highest in stage I at 2.86 ┬▒ 0.81 mg/L and lowest in stages FG at 2.34 ┬▒ 0.59 mg/L (p=0.030, Table 4).
Post hoc analysis revealed significant differences in serum IGF-1 levels between all groups, except for the MP3 G - H (p=1.0), G - I (p=0.427) and H - I (p=1.0) stage pairs (Fig. 2). In contrast, there was a significant difference in the mean serum IGFBP-3 levels only between the MP3 - F and I stages (p=0.02, Fig. 3).
4. Trend Test of Mean Serum IGF-1 and IGFBP-3 Levels According to SMI and MP3 Stage
Regarding the mean level of serum IGF-1, there was a statistically significant increasing trend as the SMI stages progressed to stage 6 - 8 and the MP3 stages progressed to G (p < 0.001). A decreasing trend was observed as the SMI stage advanced to stage 11 (p=0.009, Fig. 2).
On the contrary, for the mean level of serum IGFBP-3, SMI stages 9 - 10 and MP3 stage I showed the highest levels, but it was challenging to find a significant trend using both radiographic analysis methods (Fig. 3).
5. Correlation between SMI, MP3 stages and Age, Sex, Serum IGF-1, IGFBP-3
There was a relatively strong positive correlation between chronological age and the SMI stage as well as between chronological age and the MP3 stage (r = 0.842 in SMI stage and r = 0.741 in MP3 stage, p < 0.0001). Conversely, there was no significant correlation between sex and both SMI and MP3 stages.
The correlation coefficient between the SMI and MP3 stages was 0.917 (p < 0.001), indicating a strong correlation. Although the SMI stage showed a slightly higher correlation coefficient than the MP3 stage with serum IGF-1 levels, both methods showed a relatively high correlation with serum IGF-1 levels (r = 0.698 in SMI stage and r = 0.622 in MP3 stage, p < 0.0001). Serum IGFBP-3 levels showed a weak correlation with the SMI and MP3 stages (r = 0.186 in SMI stage, p=0.008 and r = 0.218 with MP3 stage, p=0.007, Table 5).
Based on this, stepwise multiple regression analysis was conducted to predict the SMI and MP3 stages (Table 6, 7). In this model, age and IGF-1 level were found to have significant associations with SMI and MP3 stages (p < 0.0001). The age showed the highest associations with SMI and MP3 stages and the older the age, the higher the stages (╬▓ = 0.749 in SMI model and ╬▓ = 0.599 in MP3 model). Serum IGF-1 had a relatively lower impact compared to age, and its influence was greater in the MP3 stage compared to the SMI stage (╬▓ = 0.19 in SMI model and ╬▓ = 0.29 in MP3 model). Serum IGFBP-3 did not show a significant association in either of the two models (p=0.927 in SMI model and p=0.128 in MP3 model). The adjusted R-squared value for the SMI prediction model was 0.752, indicating an explanatory power of 75.2%. The MP3 prediction model had an adjusted R-squared value of 0.648, indicating an explanatory power of 64.8%.
Discussion
Accurate assessment of individual growth and development is essential for selecting the appropriate treatment timing and establishing long-term treatment plans for growing patients[22,23].
Several studies have reported on the stage of peak height velocity in SMI and MP3 classification. H├żgg and Taranger[9] considered SMI stage 6 as the maximum growth period and according to studies on Koreans, Kim et al.[24] reported that males are most commonly found in SMI stages 5 - 7 and females in stages 6 - 7, whereas Lee and Mah[25] reported that males are found in SMI stages 4 - 5 and the MP3 FG - G stage and females in SMI stages 3 - 4 and the MP3 F - FG stage. To improve the accuracy of growth prediction, it is recommended that additional morphological, biological, and genetic indicators be evaluated[26,27].
Serum IGF-1 and IGFBP-3, which are stable indicators of GH status, are used as one of the indicators[28-30]. Loche et al.[14] reported a correlation between increased serum IGF-1 levels and the pubertal growth spurt. Juul et al.[31] reported that the serum IGFBP-3 levels increase in children and reach a peak during puberty; however, the correlation between serum IGFBP-3 and skeletal maturity remains controversial.
According to this study, the chronological age of females consistently appeared to be younger than that of males, with a mean difference of 0.97 in SMI group and 1.25 years in MP3 stages. This is consistent with previous studies showing that females exhibit faster skeletal maturity than males[8,25,26,32]. The chronological age range corresponding to stage G was found to be positioned between the SMI 4 - 5 and SMI 6 - 8 groups.
Masoud et al.[19] reported that the highest serum IGF-1 level was 359.06 ┬▒ 112.5 ┬Ąg/L at SMI 6 - 8 and the lowest was 185.5 ┬▒ 59.9 ┬Ąg/L at SMI 1 - 3 stages. In a study by Phogat et al.[18], the highest concentration was 328.43 ┬Ąg/L at SMI stages 7 - 8 and the lowest was 172 ┬Ąg/L at SMI stages 1 - 2. Consistent with previous studies, in this study, the mean serum IGF-1 level among the SMI groups showed a statistically significant difference with the highest levels observed at SMI stages 6 - 8 and the lowest at SMI stages 1 - 3.
Muddaiah et al.[33] reported that serum IGF-1 level was highest at MP3 G stage with 359.06 ╬╝g/L values and lowest at F stage with 184 ╬╝g/L. Gupta et al.[20] reported that the serum IGF-1 levels showed a gradual increase from the MP3 - F stage to the highest concentration at the MP3 - G stage, up to 397 ┬Ąg/L, and then decreased at the MP3 - H and I stages to 263 ┬Ąg/L, which is consistent with the results of this study.
While the previous studies and the present study align in terms of the stage and trend where the maximum value of serum IGF-1 occurs, there were differences in the measured mean levels of serum IGF-1. The differences in concentration may be attributed to the limited sample size in previous studies and racial differences among the study subjects, as well as variations in the criteria for selecting the study population. Furthermore, there is a possibility that the differences in blood testing methods could also contribute to variations in the results.
Song et al.[34] reported that in normal Korean children and adolescents, the highest serum IGF-1 levels were observed in males aged 15 - 16 years, with a maximum of 556 ┬Ąg/L, and in females aged 13 - 14 years, with 554 ┬Ąg/L. In this study, the SMI 6 - 8 stage showed mean serum IGF-1 levels of 502.24 ┬Ąg/L and 510.63 ┬Ąg/L in MP3 stage. Both studies showed maximum values above 500, but in this study, the mean level of IGF-1 reached its peak at an earlier age compared to previous research. These results suggest that improved nutrition intake has led to an accelerated growth rate in children and adolescents, resulting in an earlier onset of puberty than in the past[25].
Jain et al.[21] reported that IGFBP-3 levels could be a potential biochemical indicator for evaluating skeletal maturity. However, it was challenging to find a clear trend in serum IGFBP-3 based on SMI and MP3 stages in this study and significant results were not found in either the SMI or MP3 stages, with concentration differences between stages ranging from 0.02 mg/L to 0.43 mg/L. This could be attributed to racial or study subjects differences[35]. For serum IGFBP-3, it has been reported that the values could vary depending on the testing method or kit used, which could also be another contributing factor [36].
Unlike serum IGFBP-3, the significant trend between SMI stages 6 - 8 and SMI stage 11 suggests that as growth progresses during puberty peak growth, the serum IGF-1 levels decrease. However, there was no significant trend between the MP3 stage G and the stages H and I. Patients who transitioned from MP3 I stage to show changes in the radius, represented by R - I, R - IJ, and R - J stages, were excluded from the MP3 stage patients group in order to solely examine the relationship between changes in the middle phalanx of the third finger and the concentrations of serum IGF-1 and IGFBP-3. As a result, the decrease in serum IGF-1 concentration was relatively minor compared to SMI group, which is why it is suggested that it did not exhibit a significant decreasing trend and had differences compared to previous studies[20,33].
The final stage of skeletal maturity on a hand-wrist radiograph does not necessarily indicate the completion of growth. Mandibular growth continues, even after the completion of skeletal maturity on the radiographs[37,38]. In this study, the pattern of serum IGF-1 levels showed a gradual decrease after peaking in SMI 6 - 8 stages, but the mean serum IGF-1 level in SMI 11 stage was significantly higher than that in SMI 1 - 3 stages. The reported Mean serum IGF-1 level of healthy adults aged 20 and above in South Korea is 184.6 ┬▒ 86.3 ┬Ąg/L for males and 178.6 ┬▒ 91.8 ┬Ąg/L for females[39]. These values were lower than the measurements observed in the SMI stages 1-3 of this study. Based on the IGF-1 levels, it may be difficult to determine complete growth on radiographs, even at SMI stage 11. Therefore, IGF-1 levels could be considered an auxiliary tool for predicting residual growth, even after fusion has been completed on radiographs.
The correlation coefficients between the SMI and MP3 and the IGFBP-3 levels were low at 0.186 and 0.218, respectively. Thus, determining skeletal maturity solely based on serum IGFBP-3 levels may be difficult. In contrast, the SMI and MP3 stages showed relatively strong positive correlations with serum IGF-1 levels (r = 0.698 in SMI stage and r = 0.622 in MP3 stage).
The multiple regression models derived from this study allow for an estimation of SMI and MP3 stages based on Age and serum IGF-1 level. However, due to the relatively greater influence of Age, it is suggested to consider the patientŌĆÖs age when using serum IGF-1 level as an additional tool for evaluating skeletal maturity. If the results of this study are applied clinically, it may be possible to partially replace periodic hand-wrist radiographs to determine the timing of orthodontic treatment in children and adolescents by gauging the peak growth period through changes in serum IGF-1 concentrations. Additionally, when predicting the residual bone growth after SMI stage 11, IGF-1 concentration can be utilized as an adjunctive tool.
This study had some limitations. Due to its retrospective nature, the sample size for each skeletal maturity stage was inconsistent and limited. The study participants were selected based on those who had undergone both hand-wrist radiography and blood tests on the same day, mostly for orthodontic or growth evaluation purposes, which may have introduced a selection bias. Despite selecting healthy children and adolescents with no growth issues based on medical records and blood tests, it was difficult to completely exclude children with undiagnosed precocious puberty or delayed growth, which may have led to bias.
The results of this study may not represent the average values of serum IGF-1 and IGFBP-3 in Korean children and adolescents. Therefore, further nationwide sampling of serum IGF-1 and IGFBP-3 levels is needed for subsequent studies on the average values and their correlation with skeletal maturity in this cohort.
Recently, there has been an increasing interest in biomarkers, and studies analyzing skeletal maturity using salivary IGF-1 and IGFBP-3 have also been reported. As it is less invasive than blood tests and can be easily collected in dental clinics, sufficient research on the diagnostic usefulness of salivary IGF-1 and IGFBP-3 is needed[16,40].
Conclusion
Serum IGF-1 and IGFBP-3 levels correlated with skeletal maturity, as assessed by hand-wrist radiographs. Serum IGF-1 levels showed the lowest concentrations in the SMI 1 - 3 and MP3 - F groups, and the highest concentrations in the SMI 6 - 8 and MP3 - G groups gradually decreased as skeletal maturity progressed. The range from the mean serum IGF-1 level of 472 ┬Ąg/L in SMI 6 stage to the mean IGF-1 level of 510.63 ┬Ąg/L in MP3 - G stage could be considered as the peak height velocity in clinical practice. Measuring serum IGF-1 levels could reduce radiation exposure from periodic hand-wrist radiographs and assist in predicting the peak growth spurt and residual growth potential of the bone.

 PDF Links
 PubReader
 ePub Link
 Full text via DOI
 Download Citation
 Print
Print